In this fully updated 2026 guide, we break down exactly how a snow day calculator works for every Canadian province, what factors drive school closure decisions from coast to coast, province-by-province closure rates, and how you can get the most accurate snow day prediction possible for your exact city and school board.
Whether you are in Newfoundland dealing with 325 cm of annual snowfall, in Calgary watching a Chinook warm things up 30 degrees overnight, or in Vancouver bracing for the rare freeze that sends the Lower Mainland into chaos, this guide has you covered.
What Is a Snow Day Calculator and How Does It Work in Canada?
A Snow Day Calculator is a digital prediction tool that estimates the probability of school closures or bus cancellations due to winter weather. Unlike a simple weather forecast, a snow day calculator does not just tell you how much snow is coming. It combines multiple variables and weights them against each province's unique infrastructure, school board policies, and historical behavior.
Key Variables Every Canadian Snow Day Calculator Analyzes
- Snowfall accumulation (in centimetres): The raw amount of snow forecast to fall, with particular emphasis on overnight accumulation that road crews cannot clear before the morning rush.
- Wind chill temperature: Canadian school boards can and do close schools for dangerous cold alone. When wind chill approaches -25°C or lower, frostbite risk for students at bus stops becomes a serious safety concern.
- Storm timing: A storm that drops 20 cm by 3 a.m. is much easier to manage than one still dumping snow at 7 a.m. The calculator heavily weights whether the worst conditions coincide with the 5 to 8 a.m. commute window.
- Precipitation type: Freezing rain is consistently more dangerous than equivalent snowfall. Even a thin ice layer on roads makes bus travel treacherous and dramatically increases closure probability.
- Wind speed and blowing snow: High winds reduce visibility and create dangerous drifting, particularly on rural county roads used by school buses.
- Regional infrastructure: A city with a large fleet of plows and salting trucks (think Toronto or Montreal) handles the same snowfall very differently than a rural Nova Scotia county with limited equipment.
- Active weather warnings from Environment Canada: A blizzard warning or freezing rain warning issued by Environment Canada is a near-automatic trigger for elevated closure probability.
The most advanced calculators, like those powered by Environment Canada's 2.5 km resolution forecast grid, update their predictions multiple times per day, reflecting the rapid changes that characterize Canadian winter storms.
The single most important factor in any Canadian snow day calculation is storm timing. Heavy snow that ends by 3 a.m. gives plows 3 to 4 hours to clear roads before school buses roll. The same snowfall arriving at 5 a.m. almost guarantees cancellations across most provinces.
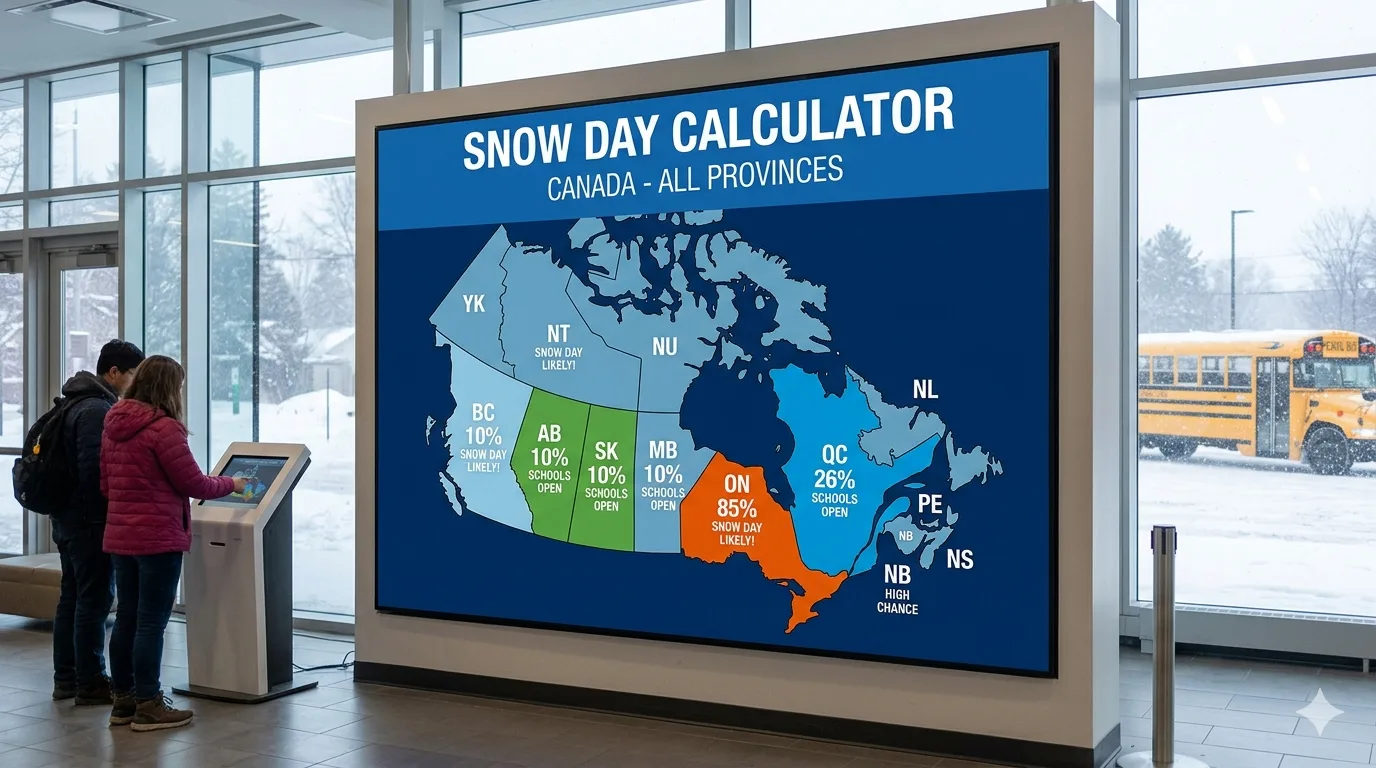
Snow Day Calculator Canada: Province-by-Province Breakdown
Canada is not a single winter climate. It is ten distinct ones. Understanding how your province approaches school closures is just as important as knowing what the weather will do. Below is a comprehensive, province-by-province breakdown of closure patterns, triggers, and what to expect from a Canadian snow day predictor in each region.
Ontario Snow Day Calculator: The Most Complex Province
Ontario is the most difficult Canadian province to generalize because it spans 1,600 kilometres from Windsor in the southwest to Thunder Bay in the north. The difference in school closure rates within a single province is extraordinary.
The Toronto District School Board (TDSB), Canada's largest with 235,000 students, closes only 2 to 5 times per year despite the city receiving about 130 cm of annual snowfall. Urban density, superior road maintenance, and the institutional inertia of closing 582 schools simultaneously all push the TDSB toward staying open.
Meanwhile, Northern Ontario boards like Algoma, Lakehead, and Rainbow DSB in Sudbury close 8 to 13 times per year. These communities receive over 300 cm of annual snowfall, and their school buses traverse rural Canadian Shield roads that are far more difficult to clear quickly.
Lake-effect snow is the critical variable in central Ontario. The Simcoe County District School Board in Barrie, sitting directly in the path of Georgian Bay lake-effect snowbands, averages 6 to 10 closures per year, among the highest rates for any Ontario board serving a city over 100,000 people.
Quebec Snow Day Predictor: A Culture of Winter Resilience
Quebec presents a fascinating paradox. Montreal receives approximately 210 cm of snow per year, comparable to Ottawa and more than most of Ontario's major cities. Yet Montreal schools close only 2 to 4 times per year on average, far less frequently than one might expect.
The reason is cultural and infrastructural. Montreal operates what many urban planners consider the world's most aggressive snow removal system. The city does not just plow streets; it physically removes snow from the island, operating a fleet of over 3,000 pieces of equipment. When a major storm hits, roads are cleared faster than virtually anywhere else in the world.
Quebec City sees 3 to 6 closures per year due to its position in a natural geographic snow funnel between the Laurentian Mountains and the St. Lawrence River. The Eastern Townships, with elevated terrain, see 4 to 7 closures annually.
"Montreal averages approximately 210 centimetres of snow per year, yet schools close far less frequently than comparable Canadian cities. The city's world-class snow removal infrastructure and a deeply embedded culture of winter management are the primary explanations." Adapted from SnowPredictor.ca, Quebec Snow Day Analysis, 2026
British Columbia Snow Day Calculator: Two Completely Different Provinces
British Columbia is effectively two winter weather provinces in one. The Lower Mainland (Vancouver, Surrey, Burnaby, Richmond) averages just 0 to 3 school closures per year, with many winters producing none at all. When the Lower Mainland does close, it is almost always for a freezing rain event rather than snowfall, because the region's steep residential streets and lack of winter equipment make ice far more dangerous than snow accumulation.
The BC Interior (Kamloops, Kelowna, Prince George) is a completely different story. Interior school boards average 3 to 8 closures per year due to substantially heavier mountain snowfall. Northern BC communities face conditions comparable to Northern Ontario, with drifting snow, extreme cold, and rapidly changing mountain weather all contributing to a much higher closure rate.
Alberta, Saskatchewan, and Manitoba: The Prairie Paradox
The Prairie provinces represent one of the most striking anomalies in Canadian snow day data. These three provinces experience some of the most severe winter weather in the country: extreme cold with wind chills regularly reaching -40°C, blizzard conditions, and heavy blowing snow. And yet their schools almost never close.
Edmonton Public Schools reported zero snow days in the last decade. The Winnipeg School Division has not had a snow day in over 30 years. Their stated policy is that schools remain open unless city buses shut down entirely.
The explanation is a combination of extreme infrastructure investment, decades of cultural adaptation to harsh winters, and a pragmatic attitude that if conditions were a closure trigger, schools would be cancelled for months each year. Prairie communities have simply built systems, and a mindset, around functioning in extreme cold.
"We have not had a 'snow day' in over 30 years. Our policy is that schools remain open unless city buses are shut down." Radean Carter, Spokesperson, Winnipeg School Division, via CBC News
Atlantic Canada: Canada's Snow Day Capital
Newfoundland and Labrador holds the record for the highest school closure rate of any Canadian province. St. John's averages 325 to 360 cm of snow per year, more than any other major Canadian city. The Avalon Peninsula juts directly into the northwest Atlantic, sitting at the convergence of the cold Labrador Current and the warm Gulf Stream. This temperature contrast fuels intense cyclogenesis: storms that form offshore, rapidly intensify, and make landfall at full force.
The result is 10 to 15 school closures per year as the baseline. In a bad year like 2026, Nova Scotia's Annapolis Valley reached 11 closures before March, and education researcher Paul Bennett warned the province was on pace to break all-time records.
Freezing rain is a particular concern across Atlantic Canada. Because Atlantic temperatures hover near 0°C during winter storms, precipitation frequently falls as ice rather than snow. A thin coat of ice on roads and power lines is more disruptive and dangerous than even significant snow accumulation.
Annual Snow Day Closures by Province: Data Chart
The chart below visualizes average annual school closures across Canadian provinces, based on Environment Canada data and school board records. This data represents typical years under neutral El Nino-Southern Oscillation conditions.
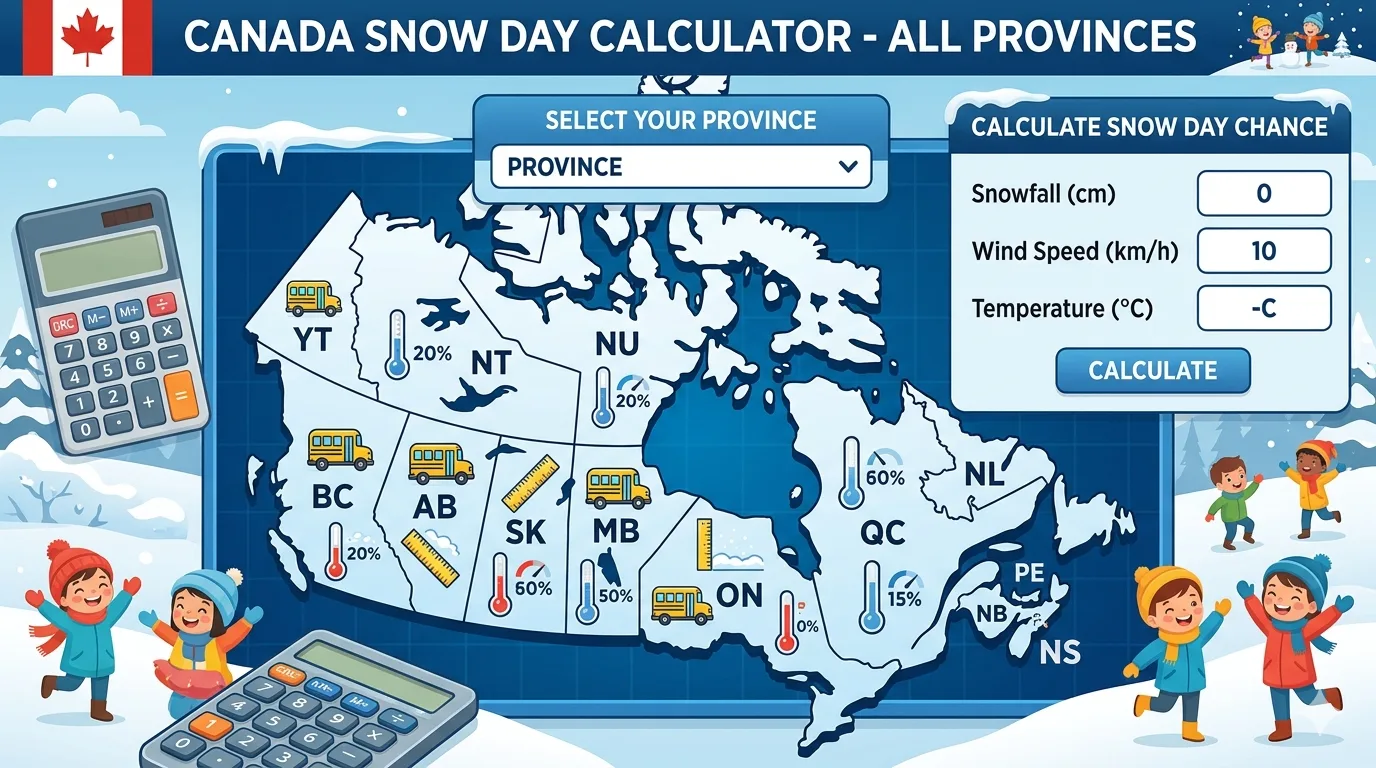
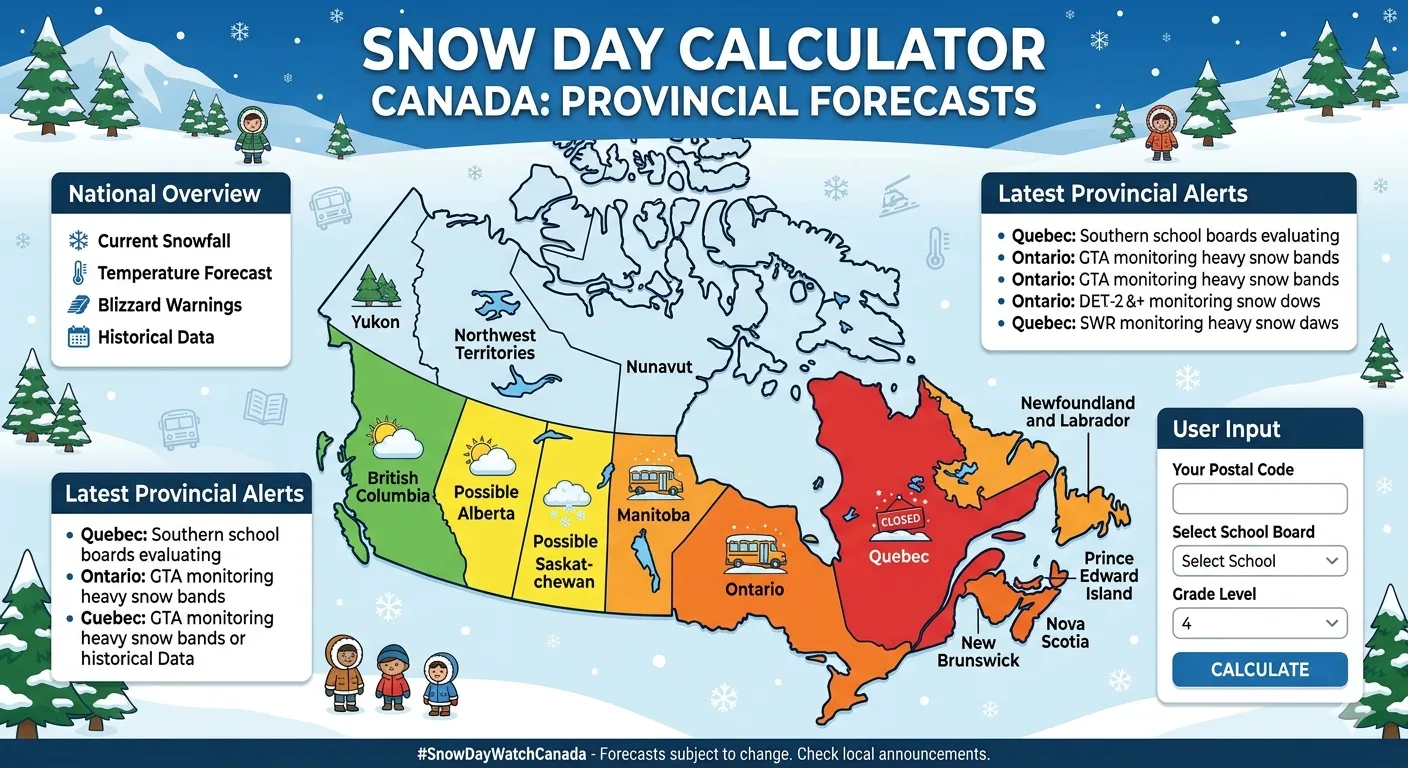
How to Use a Snow Day Calculator Canada: Step-by-Step
Getting the most out of a Canadian snow day predictor takes less than two minutes. Here is a step-by-step walkthrough that applies to all major Canadian snow day tools.
Open the tool and select Canada
Many calculators cover both Canada and the United States. Always confirm you are using the Canadian-specific version, as closure thresholds, precipitation units (centimetres, not inches), and temperature units (Celsius, not Fahrenheit) differ significantly.
Enter your city, postal code, or province
For best results, enter your specific city rather than just your province. A prediction for Barrie is meaningfully different from one for Toronto, even though both are Ontario. Most tools accept Canadian postal codes (e.g., M5H 2N2) for highly localized results.
Review the probability score and risk level
A well-calibrated snow day calculator will display a percentage (0 to 100%) along with a color-coded risk tier: typically green for under 40%, blue or yellow for 40 to 69%, orange for 70 to 89%, and red for 90% and above.
Check the specific weather factors driving the score
Look beyond the headline percentage. A 65% prediction driven primarily by freezing rain risk is more concerning than the same number driven mainly by 10 cm of daytime snowfall. Understanding which factor is moving the needle helps you plan more effectively.
Re-check after the evening forecast update
Environment Canada updates its weather models multiple times daily. A prediction checked at noon can change significantly by 10 p.m. as storm tracks sharpen. Check again in the evening for the most accurate next-day prediction.
Confirm with your school board
No calculator is a substitute for an official announcement. Once the probability is high, monitor your school board's website, social media channels, and local radio. Most Canadian school boards announce closures between 5:30 and 7:00 a.m.

Snow Day Probability Thresholds: What the Numbers Mean
Understanding what a probability percentage actually means in a Canadian context prevents both unnecessary panic and dangerous under-preparation. Here is how to interpret the four standard risk tiers used by most Canadian snow day calculators.
| Probability Range | Risk Level | Typical Situation | Recommended Action |
|---|---|---|---|
| Under 40% | Low Risk | Light to moderate snowfall, good timing, no warnings active | Plan for a normal school day. Monitor for updates. |
| 40% to 69% | Moderate Risk | Significant snowfall, marginal timing, or active weather advisory | Prepare a backup childcare plan. Check again at 10 p.m. |
| 70% to 89% | High Risk | Heavy snowfall, poor timing, possible freezing rain, warning issued | Activate backup plan. Expect cancellation or late start. |
| 90% and above | Very High Risk | Blizzard warning, extreme cold warning, or major ice event | Assume closure. Confirm with board but plan accordingly. |
El Nino, La Nina, and Their Impact on Canadian Snow Days in 2026
The El Nino-Southern Oscillation (ENSO) pattern in the Pacific Ocean exerts a measurable influence on Canadian winter severity and, by extension, school closure frequency. Understanding where Canada sits in the ENSO cycle gives families a useful long-range planning signal.
During El Nino winters (warmer than average Pacific ocean temperatures), most of Canada experiences a milder, less snowy winter. Ontario, Quebec, and Atlantic Canada typically see 20 to 40% fewer school closures than their long-term averages. Prairie cold events are less frequent and less extreme.
During La Nina winters (cooler than average Pacific ocean temperatures), the opposite occurs. Colder Arctic air penetrates further south and more frequently. Ontario's lake-effect snow seasons intensify because colder air creates stronger temperature contrasts over the Great Lakes, generating more powerful snowbands. Prairie extreme cold events increase in frequency and severity. Atlantic Canada sees elevated nor'easter activity. In a strong La Nina year, school closure frequencies across affected regions can increase 30 to 50% above long-term averages.
Environment Canada publishes a seasonal climate outlook each October that indicates whether the coming winter is expected to be El Nino-influenced, La Nina-influenced, or neutral. Checking this publication each fall gives Canadian families the best available advance signal for how active their region's snow day season is likely to be.
School Closure Factors Beyond Snowfall: What Canadian School Boards Actually Weigh
One of the most common misconceptions about Canadian snow days is that schools close simply because a certain number of centimetres of snow falls. In reality, the decision to close school involves a complex multi-factor assessment that varies significantly by province, school board, and even by individual transportation provider.
Transportation Safety: Bus Routes Are the Primary Driver
The vast majority of Canadian snow day declarations are driven not by the school itself closing, but by school bus cancellations. In Ontario alone, over 830,000 children rely on buses to reach school. Transportation managers monitor road conditions, plow deployment rates, and visibility across sprawling rural route networks. A bus route through a county road in Northern Ontario presents a completely different risk profile than an urban Toronto street served by snowplows every 90 minutes.
In many cases, school boards use a hybrid system: the school itself remains open for families who can transport their children safely, while school buses are cancelled for those who cannot. This creates a challenging situation for parents who must decide whether to drive their children in conditions the transportation authority has deemed too dangerous for buses.
Wind Chill: The Hidden Snow Day Trigger
Many Canadian families are surprised to learn that schools can close with zero snowfall on cold, clear days. When wind chill values approach -25°C to -30°C or lower, the frostbite risk for students waiting at outdoor bus stops becomes a genuine safety issue. Younger children, in particular, are vulnerable because they have a higher surface-area-to-mass ratio than adults and lose heat more rapidly.
The Prairie provinces are the obvious exception here. Communities in Winnipeg, Regina, and Edmonton routinely experience wind chills of -40°C or colder and do not close schools, because their students are equipped, their schools are prepared, and closing for such conditions would mean closing for a significant portion of every winter.
Freezing Rain: The Most Disruptive Canadian Winter Hazard
Among all winter weather types, freezing rain generates the highest school closure rates per unit of precipitation in Canada. A half-centimetre of freezing rain accumulation can make untreated roads essentially impassable, glaze bus steps and school walkways into slip hazards, and take down power lines. Atlantic Canada's frequent near-zero temperature winter storms mean that freezing rain events are a regular occurrence from December through March.
Tip for parents: When checking a snow day calculator, pay closer attention to the "ice risk" or "freezing rain probability" indicator than to the raw snowfall total. A forecast showing 5 cm of snow plus a 60% chance of freezing rain carries a higher actual closure risk than 20 cm of dry powder in a cold Arctic airmass.
Comprehensive Snowfall Data: Canada's Snowiest and Least Snowy Cities
| City | Province | Annual Snowfall (cm) | Avg. Annual School Closures | Primary Closure Trigger |
|---|---|---|---|---|
| St. John's | NL | 325–360 cm | 10–15 days | Nor'easters, blizzards |
| Barrie | ON | 270 cm | 6–10 days | Georgian Bay lake effect |
| Quebec City | QC | 337 cm | 3–6 days | Blizzard, major accumulation |
| Halifax | NS | 261 cm | 4.6 days | Nor'easters, freezing rain |
| Montreal | QC | 209 cm | 2–4 days | 30+ cm blizzard, ice storms |
| Ottawa | ON | 221 cm | 4–7 days | Ottawa Valley storm track |
| Toronto | ON | 130 cm | 2–5 days | Major ice event, significant snow |
| Calgary | AB | 129 cm | Rarely | Extreme blizzard (very rare) |
| Edmonton | AB | 131 cm | ~0 days | N/A (city buses shutdown) |
| Vancouver | BC | 37 cm | 0–3 days | Freezing rain on steep streets |
How to Get School Closure Notifications in Each Canadian Province
Knowing a school closure is coming before you wake up at 5:30 a.m. scrambling is crucial for families and employers alike. Each province has its own notification ecosystem, and being plugged into the right channels for your specific school board dramatically reduces last-minute chaos.
Ontario
The TDSB and most Ontario school boards announce closures via their official website, automated phone messaging systems, and social media channels (primarily Twitter/X and Facebook). Many boards also use apps like SchoolMessenger. Local radio stations including AM680, CP24, and AM1010 in Toronto broadcast school closure updates from 6 a.m. onward. Check individual transportation consortium websites (such as NPSSTS in Northern Ontario) for bus-specific cancellations that may occur independently of school closures.
Quebec
French-language school boards use the fermeture des ecoles announcement format on board websites. Radio-Canada, TVA, and 98.5 FM in Montreal are the primary broadcast sources. English boards like the EMSB communicate via their website and CTV Montreal. Note that French and English boards in Montreal occasionally make different decisions on marginal weather days.
Atlantic Canada
Atlantic provinces make heavy use of local radio, with stations like News 95.7 Halifax, Ocean 100 in Charlottetown, and VOCM in St. John's serving as primary closure announcement platforms. School board websites and provincial government Twitter accounts also carry official announcements. Given the frequency of closures, many Atlantic families set up Google Alerts for their school board's name.
British Columbia
BC school districts post closure and bus cancellation notices on their websites and the provincial School District Closure page. Local radio and district social media accounts are the fastest real-time sources. The BC Ministry of Education also maintains a province-wide school status page during major weather events.
Read More : Snow Days for Teachers
Snow Day Impact on Canadian Students and Families: The Bigger Picture
Snow days are not simply a logistical inconvenience. They ripple across the education system, workforce, and economy in ways that have attracted serious academic attention.
A landmark study by Harvard University researcher Joshua Goodman examined snow days in Massachusetts schools from 2003 to 2010. His research found that full school closures had relatively modest effects on student learning, largely because everyone in the classroom was equally absent and teachers could adjust instruction upon return. However, individual student absences on days when schools remained open were more strongly associated with lower academic performance, particularly in mathematics.
Goodman himself cautioned that his findings, based on states averaging one to five snow days per study period, likely cannot be extrapolated to the 15 or 20 days per year seen in parts of Atlantic Canada and Northern Ontario. At those volumes, the cumulative loss of instructional time becomes genuinely significant.
Education researcher Paul Bennett of Saint Mary's University in Halifax has argued that when snow day counts reach 10 or more in a single year, the compression and consolidation of curriculum that teachers can realistically achieve begins to break down. He has advocated for mandatory remote learning protocols as a backstop for the most storm-prone regions of the country.
For working parents, the economic cost is direct and immediate. Emergency childcare, lost work hours, and the cognitive load of same-morning scrambling represent a real cost that falls disproportionately on lower-income families without flexible employment arrangements or robust childcare networks.
Tips to Maximize Your Snow Day Prediction Accuracy in Canada
- Use a calculator powered by Environment Canada data, not a US-based tool defaulting to American meteorological sources. Canadian provinces use centimetres, Celsius, and km/h, and Canadian school boards respond to specifically Canadian weather thresholds.
- Check at two times: around 10 p.m. the night before, and once more at 5 a.m. The overnight forecast update often incorporates the final model run of the day and can shift probabilities significantly.
- Look for a school board-specific predictor rather than a city-level one whenever possible. The TDSB and the Simcoe County DSB can produce very different decisions from the same storm tracking over Southern Ontario.
- Factor in the day of the week. There is anecdotal but consistent evidence that school boards in some provinces are slightly more conservative about keeping schools open on Fridays, when a closure provides a three-day weekend and reduces the pressure to make up the day later.
- Monitor Environment Canada weather warnings directly at weather.gc.ca. A blizzard warning or freezing rain warning active in your region is a near-automatic signal for elevated closure risk, regardless of what any calculator says.
- Understand your board's specific threshold. Some school boards publish their closure criteria. Knowing whether your board considers wind chill, road conditions, or accumulation amount as its primary trigger helps you contextualize probability scores correctly.
Conclusion: Using a Snow Day Calculator Canada the Smart Way in 2026
A Snow Day Calculator Canada is one of the most practically useful tools available to Canadian families during the winter months. But using it well means understanding what it is actually predicting: not certainty, but probability, calibrated to your specific region's infrastructure, school board history, and winter weather patterns.
The core takeaways from this guide are:
- Canada has enormous regional variation in school closure frequency, from Prairie cities that essentially never close to Newfoundland communities that lose 10 to 15 days per year as a baseline.
- The most powerful predictor of a Canadian school closure is storm timing, specifically whether heavy precipitation or extreme cold coincides with the 5 to 8 a.m. morning commute window.
- Freezing rain is more disruptive per millimetre than snowfall in virtually every Canadian region except the Prairies.
- El Nino and La Nina patterns provide a useful long-range seasonal signal for how active your region's snow day season is likely to be.
- Always pair a calculator-based prediction with monitoring your specific school board's official channels before making final plans.
Stay warm, stay informed, and check your Snow Day Calculator Canada tonight before the next storm arrives.
Also Checkout :