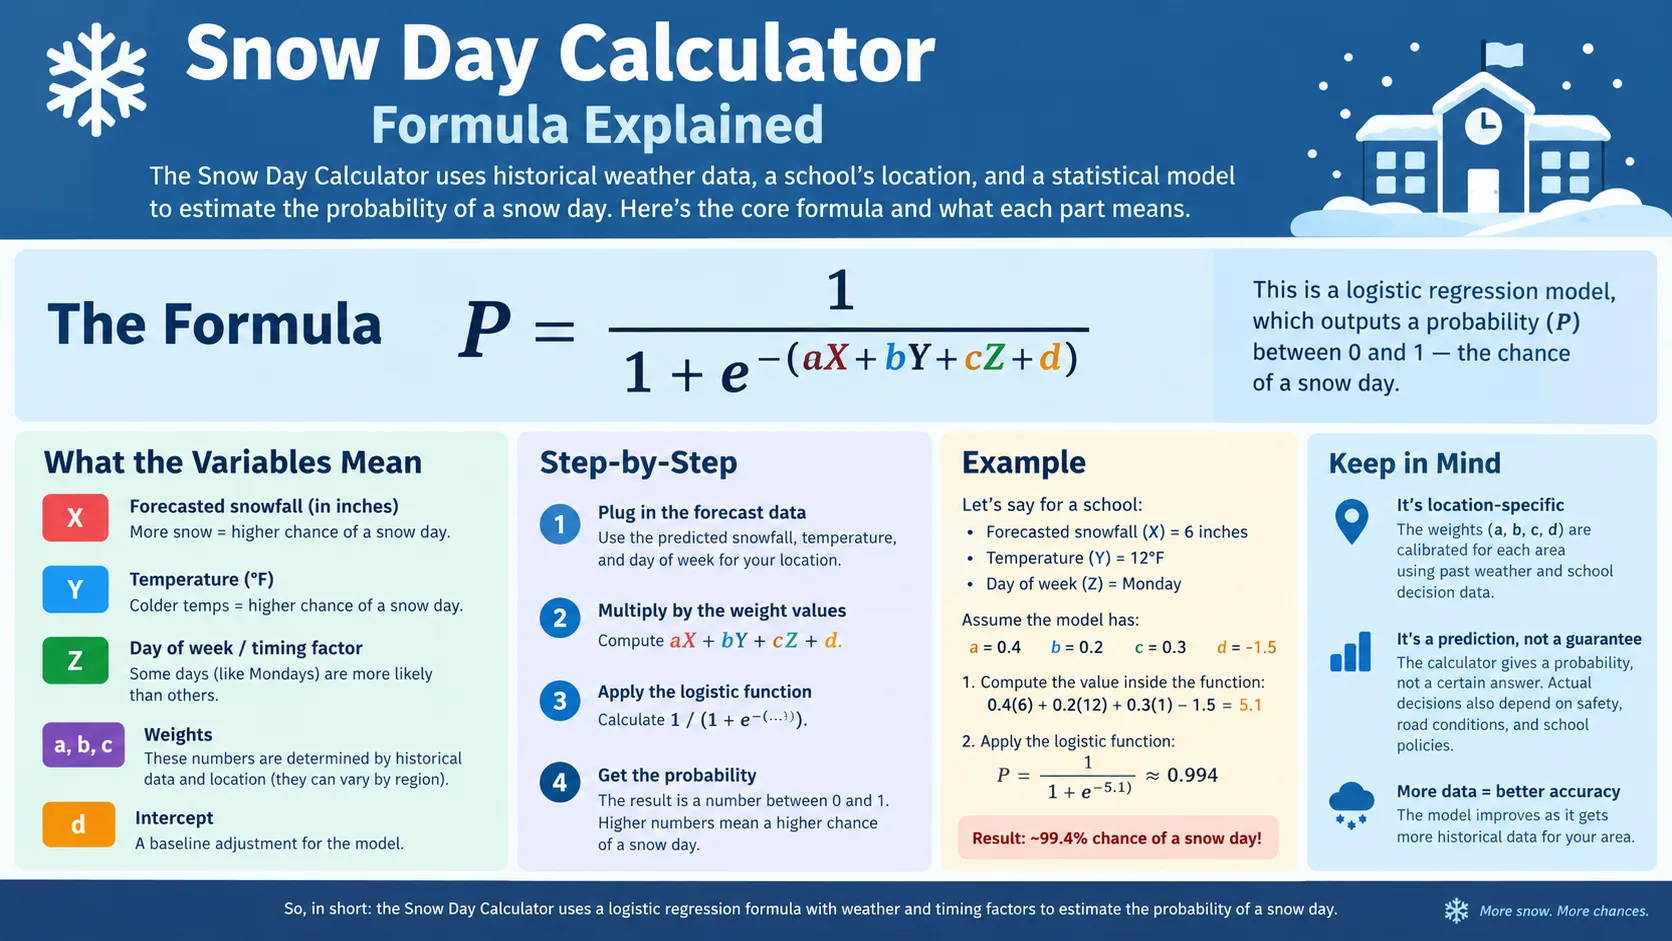
What Is a Snow Day Calculator Formula?
The snow day calculator formula is a weighted scoring system that turns raw weather data into a single closure probability. Instead of just telling you how much snow is coming, it combines snowfall, temperature, wind, ice risk, storm timing, and your district's own closure history into one number you can actually plan around.
Think of it as a recipe. Each weather ingredient gets measured, scored, and multiplied by how much it usually matters in your area. Add all of those scored ingredients together and you get a percentage: your snow day probability for tomorrow.
Every calculator's exact math is slightly different, but the underlying logic is consistent across the tools people search for most, from the main snow day predictor to regional and app-based versions.
How Does the Snow Day Calculator Formula Work?
At a high level, the formula works in three stages: data collection, factor scoring, and weighted combination.
Stage 1: Data Collection
The calculator pulls live weather data for your exact location. This typically includes:
- Forecasted snowfall totals for the next 12 to 48 hours
- Overnight and morning temperature readings
- Wind speed and gust forecasts
- Freezing rain or ice accumulation risk
- Storm timing relative to the morning commute
Stage 2: Factor Scoring
Each raw data point gets converted into a score, usually on a 0 to 100 scale. A light dusting scores low. A foot of snow arriving right before the morning bell scores high. This step is what separates a real snow day calculator formula from a plain weather forecast.
Stage 3: Weighted Combination
Once every factor has a score, the formula multiplies each one by a weight and adds the results together. Snowfall almost always carries the heaviest weight, since it is the single strongest predictor of a closure, followed by ice, temperature, timing, and local history.
The Formula Breakdown: Every Factor and Its Weight
While every tool tunes its numbers slightly differently, most snow day calculator formulas follow a similar weighting pattern. Here is a representative breakdown based on how these tools are commonly built.
| Factor | Typical Weight | Why It Matters |
|---|---|---|
| Snowfall amount | 30-35% | The strongest single predictor of a closure decision |
| Ice and freezing rain | 15-20% | Ice is harder to clear and more dangerous than snow alone |
| Temperature and wind chill | 10-15% | Extreme cold can trigger closures even with little snow |
| Storm timing | 10-15% | Overnight snow gives crews less time before the morning commute |
| District closure history | 10-15% | Some districts close easily, others rarely do, regardless of totals |
| Wind speed | 5-10% | High winds reduce visibility and create blizzard conditions |
| Local infrastructure | 5% | Plow count and road treatment capacity affect recovery speed |
According to Meagan Cole, the calculator's lead meteorology reviewer, the biggest misconception people have is treating snowfall totals as the whole story. She notes that two towns can get the exact same six inches of snow and land on completely different sides of a closure decision, purely because of how their formula weighs local history and infrastructure.
Step-by-Step: How to Use the Calculator
- Enter your location. Your ZIP code or city lets the tool pull hyper-local forecast data instead of a broad regional estimate.
- Confirm your school or district type. Urban, rural, and private schools often have different closure thresholds, and the formula adjusts for this.
- Review your snowfall and timing inputs. Double-check the forecast window matches the day you're planning for.
- Read your probability score. A percentage above roughly 70% suggests a strong chance of closure, while anything under 30% suggests school will likely run as normal.
- Check back closer to the decision window. Scores shift as new forecast data arrives, so a second look in the early morning often gives a sharper picture.
You can run this full workflow directly from the calculator directory, which includes location-specific versions built around the same underlying formula.
Real-World Example With Numbers
Here is how the formula might play out for a mid-sized Midwestern district expecting an overnight storm.
- Snowfall: 6 inches forecast overnight, scored at 85 out of 100, weighted at 35% = 29.75 points
- Ice risk: Minimal, scored at 10, weighted at 20% = 2 points
- Temperature: 8°F at bus pickup time, scored at 70, weighted at 15% = 10.5 points
- Timing: Snow falling between midnight and 5 AM, scored at 90, weighted at 12% = 10.8 points
- District history: This district has closed for similar totals in 4 of the last 5 winters, scored at 80, weighted at 10% = 8 points
- Wind: Gusts near 20 mph, scored at 40, weighted at 5% = 2 points
- Infrastructure: Moderate plow coverage, scored at 50, weighted at 3% = 1.5 points
Adding those weighted scores together produces a total of roughly 64.5 out of 100, which the calculator would likely translate into a moderate to high closure probability, somewhere in the 60 to 70% range depending on rounding.
Read More : School Closure Predictor
Why Your Location Changes the Formula
The same six inches of snow means something completely different depending on where you live. A calculator built for Minneapolis expects that amount and rarely triggers a closure for it. The same total run through a formula tuned for Atlanta or Dallas can push the score into near-certain closure territory.
This is why the state-by-state predictions exist as separate tools rather than one generic national calculator. Local infrastructure, average winter severity, and district policy all shift the underlying weights.
Urban vs Rural Differences
Urban districts typically clear main roads faster and can lean on shorter bus routes, which lowers their overall score for the same storm. Rural districts often carry longer bus routes over less-maintained roads, so the formula gives more weight to ice and temperature for these areas.
Common Mistakes When Reading Your Score
- Treating the percentage as a guarantee. A 90% score is a strong signal, not a confirmed closure.
- Checking too early. A score from three days out is based on far less reliable forecast data than one from the night before.
- Ignoring timing details. Two inches of snow at 3 PM behaves very differently in the formula than two inches at 3 AM.
- Comparing your score to a friend's in another town. Different districts run through different local weights, so scores are not directly comparable across regions.
- Forgetting wind chill and ice. Some of the highest scores come from cold snaps or ice storms with very little actual snowfall.
Pro Tips for a More Accurate Read
- Check your score once in the evening and again early the next morning, since overnight forecast updates can shift the result significantly.
- Pay attention to the timing factor specifically. Overnight and pre-dawn snow almost always scores higher than daytime snow.
- If your area is prone to ice, do not dismiss a low snowfall forecast. Ice-heavy formulas can produce high scores from very little accumulation.
- Use the wind chill calculator alongside your snow day score when temperatures are dropping fast, since extreme wind chill alone can trigger a closure.
- Cross-reference your district's past behavior. If your school has closed for similar scores before, treat that as a strong signal.
Snow Day Calculator vs Other Weather Tools
The snow day calculator formula is built specifically around closure prediction, which sets it apart from general-purpose weather tools that only report raw conditions.
| Tool | What It Measures | Best Used For |
|---|---|---|
| Snow Day Calculator | Weighted closure probability from multiple storm factors | Deciding how likely school is to close tomorrow |
| Wind Chill Calculator | Perceived cold from temperature and wind speed | Judging outdoor safety during cold snaps |
| Heat Index Calculator | Perceived heat from temperature and humidity | Summer heat safety planning, the opposite-season counterpart |
| Rain Delay Calculator | Likelihood of event delays from rainfall | Outdoor events and sports scheduling |
Daniel Ortiz, who reviewed this guide from his years directing school transportation decisions, points out that these tools are most useful when used together during a shoulder-season storm that brings both ice and dropping temperatures on the same night.
Conclusion
The snow day calculator formula turns a messy mix of snowfall, temperature, wind, ice, and local history into one clear number you can actually plan your evening around. It will never replace your school's official announcement, but it gives you a genuine head start on packing lunches, setting alarms, and prepping for whatever tomorrow brings.