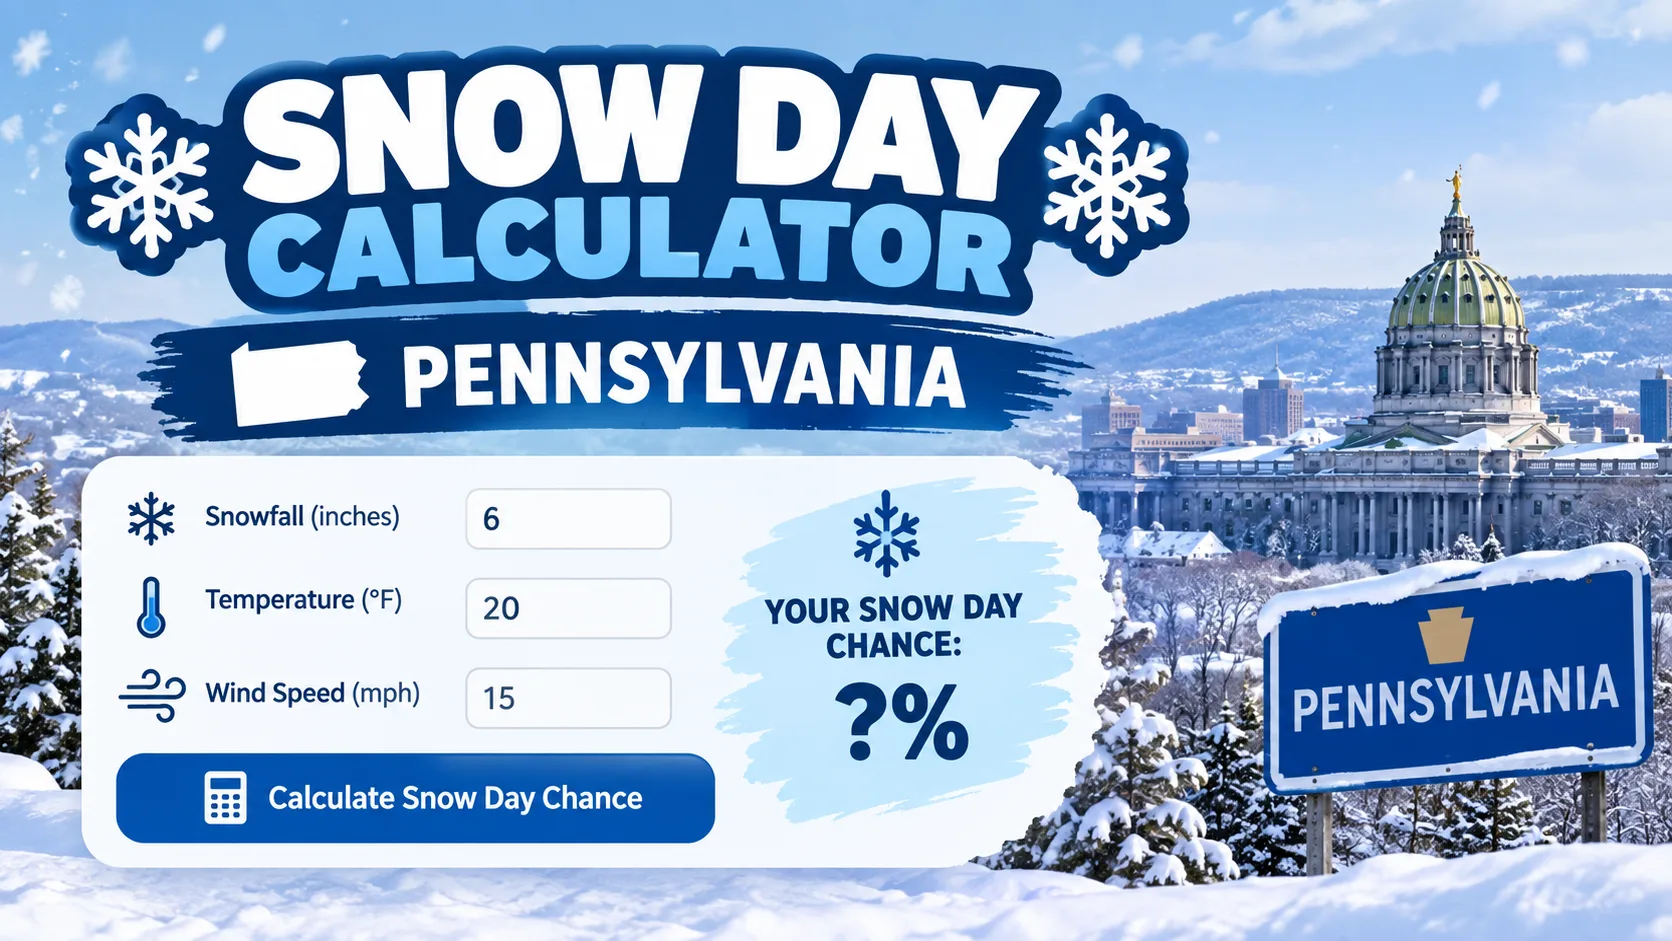
A snow day calculator for Pennsylvania estimates the odds that your school will close, delay, or hold classes as normal based on forecasted snowfall, ice, temperature, and road conditions. It cannot guarantee a closure, but it turns a confusing weather forecast into a single, easy-to-read percentage. Try the Pennsylvania snow day calculator above, then keep reading to understand exactly how the number is built.
What Is a Snow Day Calculator for Pennsylvania
A Pennsylvania snow day calculator is a weather-driven prediction tool. Instead of just showing you inches of snow, it converts several weather inputs into one closure probability. That matters in Pennsylvania because the state has three very different winter weather zones in one state line.
Erie sits on Lake Erie and gets lake-effect snow bands. Pittsburgh and the southwest deal with Allegheny Mountain enhancement. Philadelphia and the southeast see coastal nor'easters and ice storms more often than heavy powder. A single national snowfall map cannot capture that, so a calculator tuned to local closure history is far more useful than a generic forecast.
How Does the Pennsylvania Snow Day Calculator Work
The calculator does not just look at snowfall totals. It scores several weather factors, weights them, and combines them into one percentage. The main inputs are:
- Expected snowfall between midnight and the start of school
- Ice and freezing rain risk, which is often more dangerous than snow for buses
- Overnight and morning temperature, since refreezing turns wet roads into ice sheets
- Wind speed and visibility, especially for drifting snow in open farmland
- Timing of the storm relative to the 6 to 8 a.m. bus window
- District-specific closure history, since some districts cancel early and others push through almost anything
The Basic Scoring Logic
Each factor is scored on its own scale, then multiplied by a weight that reflects how much it actually influences a superintendent's decision. Snowfall and ice typically carry the heaviest weight, followed by temperature and wind. The weighted scores are added together and converted into a 0 to 100 percent closure probability. A wind chill calculator reading is often layered on top of this, since dangerously low wind chill alone can trigger a two-hour delay even without much fresh snow.
Step-by-Step Guide to Using the Calculator
- Enter your ZIP code or district name. Pennsylvania's regional differences make ZIP-level accuracy important.
- Select your school type (public, private, or charter) since thresholds differ between them.
- Choose your district's typical strictness if the tool offers a slider, based on how your district has handled past storms.
- Review the percentage and factor breakdown to see whether snow, ice, or wind chill is driving the prediction.
- Check back after 6 p.m. the evening before a potential storm, since forecast models firm up significantly within 12 hours of the event.
Typical Snow Day Thresholds in Pennsylvania
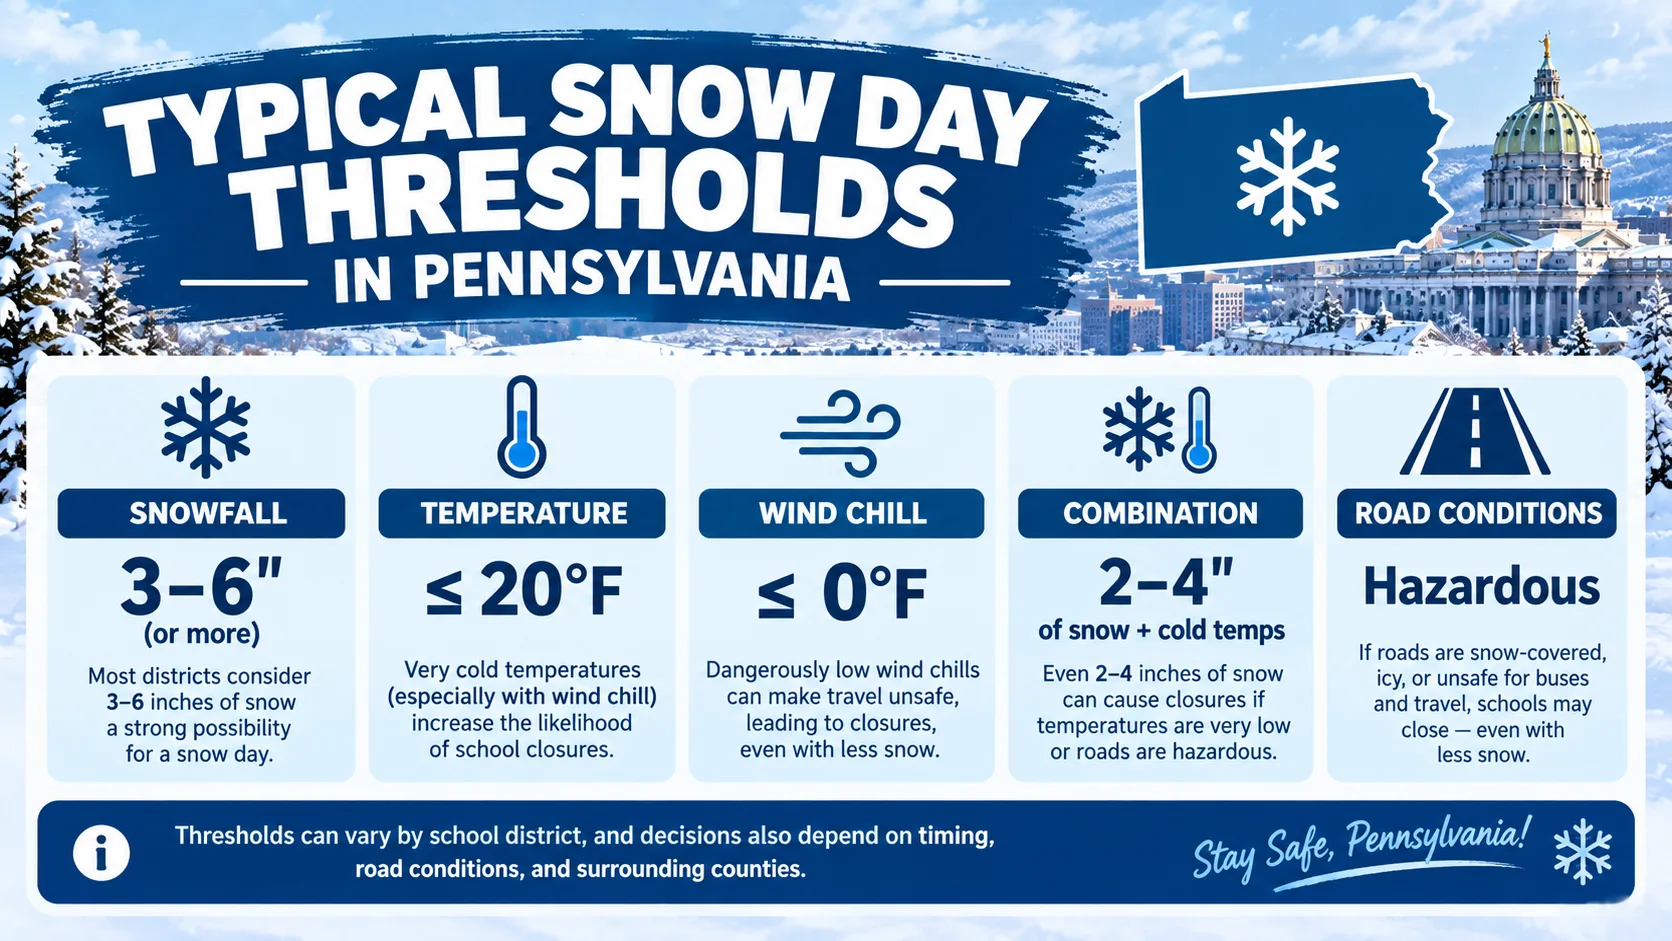
Thresholds vary by district, but most Pennsylvania schools start seriously considering closures once one or more of these conditions appear in the forecast:
| Condition | Typical Closure Threshold | Notes |
|---|---|---|
| Fresh snowfall | 4 to 8 inches by school start | Lower end for rural bus-heavy districts |
| Ice or freezing rain | Any measurable accumulation | Often triggers closure even with little snow |
| Wind chill | Below 0°F | Common trigger for delays, not always full closures |
| Visibility | Under 1/4 mile in blowing snow | Bigger factor in open, rural parts of the state |
| Road refreeze | Overnight temps near or below 20°F after melt | Creates black ice on untreated roads |
Snow Day Patterns Across Pennsylvania's Regions
Pennsylvania averages roughly 30 to 40 inches of snow per year statewide, but that number hides huge regional swings. Understanding your region's pattern helps you read the calculator's output correctly.
Northwest Pennsylvania (Erie Region)
Lake-effect snow off Lake Erie can dump heavy, narrow bands of snow that miss one town and bury the next. Erie-area districts often see the highest snow day counts in the state, sometimes topping 100 inches of snow in a heavy season.
Southwest Pennsylvania (Pittsburgh Region)
The Allegheny Mountains enhance snowfall on their western slopes. Pittsburgh splits the difference between lake-effect influence and the drier air further south, with closures often driven by hilly terrain and steep bus routes rather than raw snow totals.
Central Pennsylvania and the Poconos
Higher elevation areas in the Poconos and central mountain ridges tend to hold snow longer and see more ice, which makes ice storms, not just snowfall, a leading driver of closures.
Southeast Pennsylvania (Philadelphia Region)
Philadelphia-area districts deal more with coastal nor'easters and freezing rain than deep powder. Because these storms can flip quickly from snow to sleet to rain, Philadelphia-area schools tend to close more preemptively than mountain districts used to steady snowfall.
Real-World Example With Numbers
Say a central Pennsylvania district is forecast to get 6 inches of snow overnight, with the heaviest snow falling between 4 a.m. and 7 a.m., temperatures around 22°F, and 15 mph winds. Here is roughly how that breaks down:
- Snowfall score: high, since 6 inches falls inside the typical 4 to 8 inch closure range
- Timing score: high, because the storm overlaps directly with the morning bus window
- Temperature score: moderate, cold enough for snow to stay powdery rather than turn to slush
- Wind score: moderate, enough to cause some drifting on open roads
Combined, a scenario like this typically lands in the 70 to 85 percent closure probability range, which the calculator would flag as a likely snow day rather than a delay.
Read More : How to Enjoy a Snow Day
Common Mistakes and Pro Tips
- Mistake: Checking the calculator days in advance and treating it as final. Fix: Long-range forecasts shift, so treat anything beyond 48 hours as a rough heads-up only.
- Mistake: Ignoring ice in favor of watching the snowfall total. Fix: A quarter inch of ice can close schools that would stay open for 6 inches of dry snow.
- Mistake: Using a national average instead of your specific district history. Fix: Set your district's strictness level if the calculator allows it, since two neighboring districts can react very differently to the same forecast.
- Pro tip: Check the state-by-state prediction page to compare how Pennsylvania's typical thresholds differ from neighboring states like Ohio or New York.
Snow Day Calculator vs. Other Ways to Check for Closures
| Method | Speed | Personalization | Best For |
|---|---|---|---|
| Snow day calculator | Instant, anytime | ZIP-code and district level | Planning the night before |
| Local news broadcast | Scheduled updates | Regional, not district-specific | General storm awareness |
| District website or app | Fastest once posted | Fully accurate for that district | Final, official confirmation |
| Social media rumors | Fast but unreliable | None | Not recommended as a sole source |
The best approach is to use a calculator to plan your evening and set expectations, then confirm with your district's official closure tool or app once decisions are actually posted, usually between 5 and 6 a.m.
Conclusion
Pennsylvania's mix of lake-effect snow, mountain terrain, and coastal storms means no single snowfall number tells the whole story. A dedicated Pennsylvania snow day calculator pulls snowfall, ice, temperature, wind, and your district's own closure history into one clear percentage so you are not guessing the night before a storm. Browse the full winter weather blog for storm-by-storm breakdowns, or try the calculator above to check your own school's odds right now.