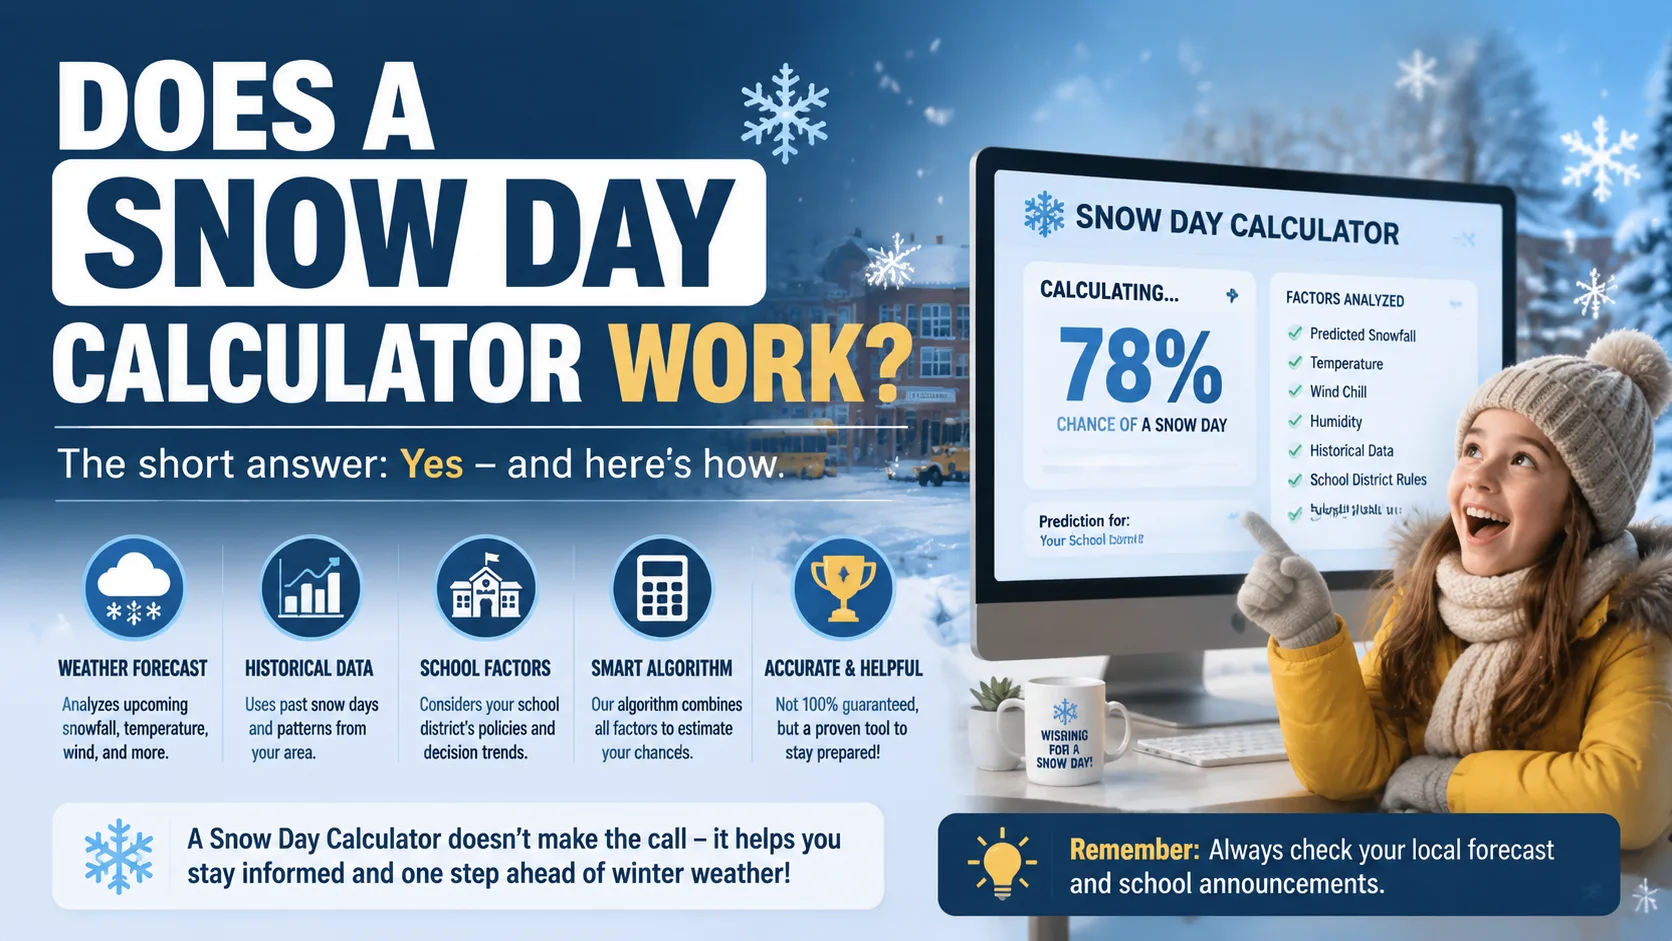
Does a snow day calculator work? Yes and no. It's a real tool built on real weather data, not a random number generator, but it's also not a reliable prediction of what your specific school will do. A snow day calculator combines forecast data, like snowfall, temperature, wind, and ice, with historical closure patterns to produce a probability score. That score can be genuinely useful as an early signal, but it cannot see inside a superintendent's decision-making process the next morning.
Below, we break down exactly what's happening behind that percentage, why accuracy claims range so wildly from one calculator to another, and how to actually use one of these tools without getting your hopes up for nothing.
What Is a Snow Day Calculator, Exactly?
A snow day calculator is an online tool that estimates the likelihood a school will close due to winter weather. Instead of just showing you a weather forecast, it tries to translate that forecast into a single, more actionable number, a probability that classes will actually be cancelled.
Most tools ask for a ZIP code or city, then pull in live weather data and run it through a scoring system. The result is usually shown as a percentage, sometimes paired with a playful label like "pack your sled" or "don't get your hopes up."
How Snow Day Calculators Actually Work
Despite how simple the output looks, there's a genuine process happening behind that percentage. Most calculators combine four categories of data.
1. Live Weather Data
The starting point is almost always the same source everyone else uses: national weather agencies such as the National Weather Service, NOAA, and Environment Canada supply the raw forecast data, including snowfall totals, timing, temperature, wind speed, and ice accumulation.
2. Storm Timing
When snow falls matters as much as how much falls. A storm that arrives overnight and finishes before sunrise has a very different closure probability than the same snowfall total spread across the school day. Calculators weigh timing heavily for exactly this reason.
3. Historical District Behavior
This is the part that separates a real calculator from a basic weather widget. Better tools track how a specific school district has responded to past storms, whether it typically closes at 3 inches or waits until 8, whether it leans cautious or stubborn, and feed that pattern back into future predictions.
4. Road and Ice Conditions
Snowfall total alone rarely tells the whole story. Freezing rain and ice are often weighted more heavily than snow in these algorithms, since icy roads create more hazardous driving conditions for buses than an equivalent depth of dry snow.
The "Formula" Behind the Prediction
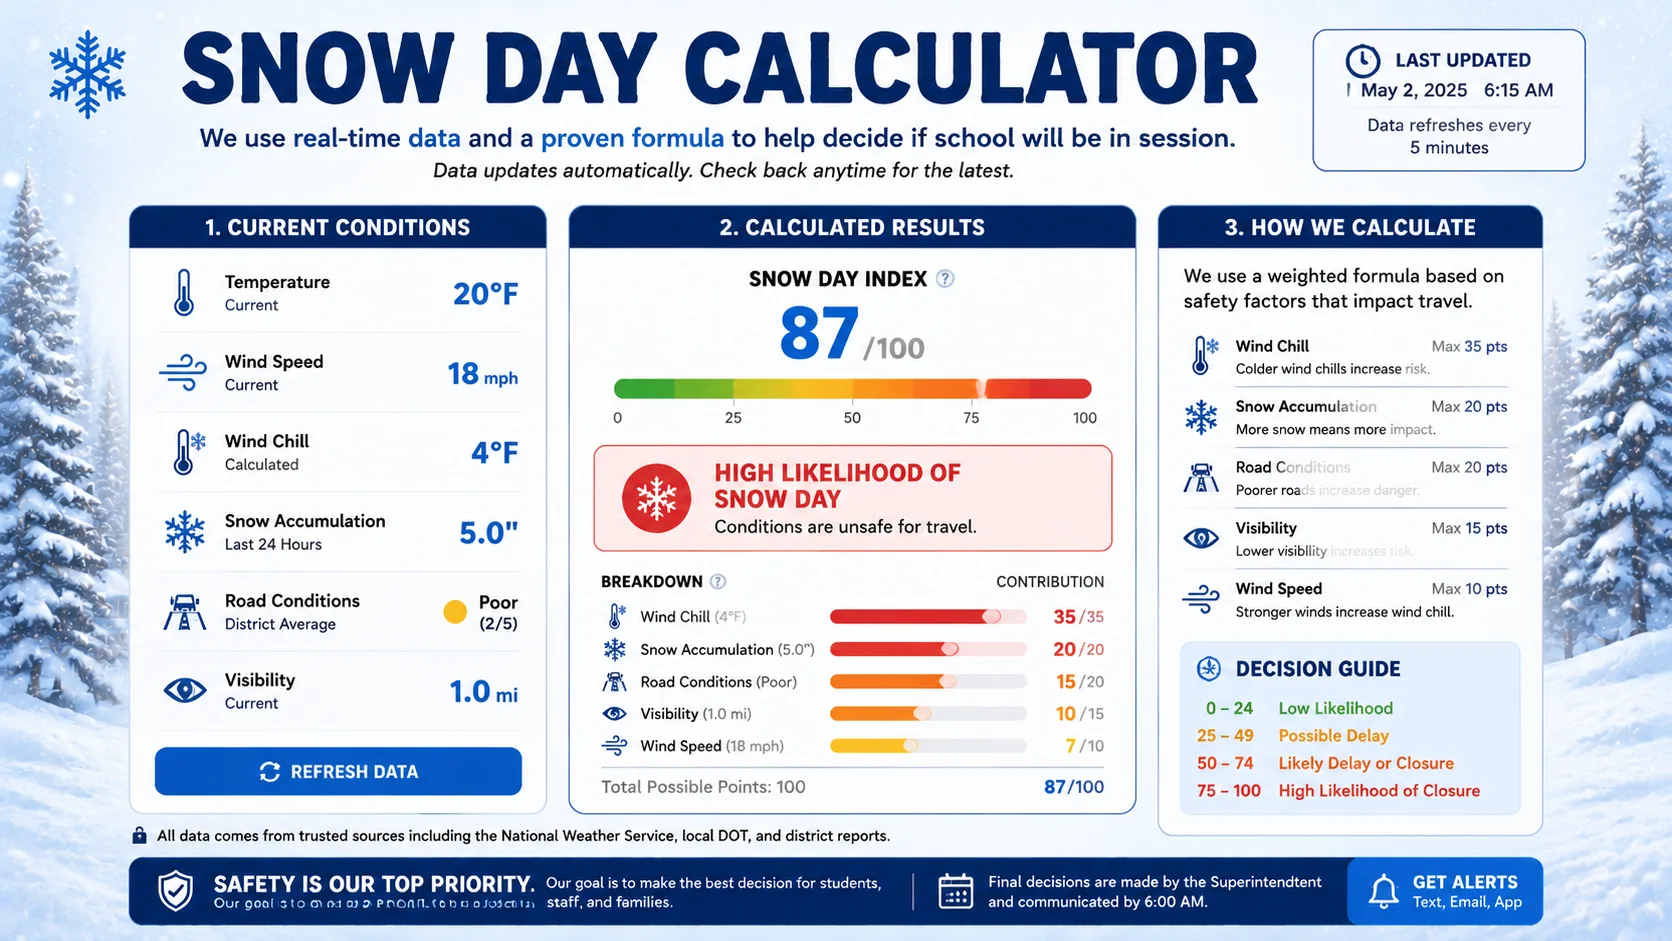
There's no single universal formula, since every calculator uses its own proprietary weighting. But most follow a similar structure: each input is scored, weighted by importance, and combined into a final probability.
| Factor | Why It's Weighted Heavily |
|---|---|
| Snowfall total (inches) | Baseline signal, but rarely decisive on its own |
| Ice / freezing rain accumulation | Considered the biggest single risk factor for bus safety |
| Storm timing (overnight vs. daytime) | Overnight storms give road crews time to clear routes before buses run |
| Wind speed and wind chill | Affects visibility and bus-stop safety, especially in extreme cold |
| District's historical closure threshold | The single strongest predictor of what a specific district will actually do |
In simple terms, the calculator is trying to answer a two-part question: how bad will conditions actually get, and how cautious is this specific district historically? The first half is a weather problem. The second half is a human behavior problem, and that's where accuracy starts to break down.
So, Does a Snow Day Calculator Actually Work?
Here's the honest answer: it works as a weather-informed estimate, not as a guaranteed prediction. The tools genuinely process real forecast data and real historical patterns. What they can't do is read a superintendent's mind the next morning.
One creator of a popular snow day calculator, David Sukhan, has described the tool as an algorithm that improves over time by learning from whether past predictions were right or wrong. That's a meaningfully different claim from "it's always accurate." It's a system designed to get better, not a system that's already perfect.
That nuance gets lost in marketing. If you search around, you'll find wildly different accuracy claims from different tools, some claiming 98% accuracy, others admitting to 50 to 70%. Almost all of these numbers are self-reported by the companies that built the tools, not independently verified by a third party. That doesn't mean they're lying, but it does mean you should treat any specific accuracy percentage with healthy skepticism.
Why Accuracy Claims Vary So Much
- Heavy snow events are easier to predict than borderline ones. When 10+ inches are forecast, almost every district closes, so accuracy naturally looks higher.
- Light snow is where predictions fall apart. A forecast of 2 to 4 inches can go either way depending entirely on district policy and timing, which is much harder to model.
- Different vendors define "accurate" differently. Some count a close prediction as a win; others require an exact match to the district's actual decision.
- No public database of school closures exists, so calculators are often built on incomplete or self-collected historical data rather than a verified national record.
| Forecast Snowfall | Vendor-Reported Accuracy Range |
|---|---|
| 2–4 inches (light) | 60–70% |
| 5–8 inches (moderate) | Around 85% |
| 10+ inches (heavy / blizzard conditions) | 85–98% |
Note: These figures come directly from calculator vendors' own marketing pages, not independent audits. Treat them as a general pattern, heavier storms are easier to call correctly, rather than a guaranteed number for your district.
Why Snow Day Calculators Get It Wrong
Even a well-built calculator runs into the same handful of problems every winter.
- Forecasts change fast. A storm can shift track or weaken between the night-before prediction and the actual morning, and the calculator's number doesn't always update in time.
- Districts don't decide until very early morning, often after road crews report back on actual conditions, which is later than when most people check the calculator.
- Policy differs enormously by district. One school two towns over might close for a dusting, while a neighboring district stays open through a genuine storm.
- End-of-year and holiday timing can override the weather entirely. Some districts avoid closures near the end of the school year to protect instructional days, regardless of conditions.
- Local factors aren't visible to a national tool. Bus driver shortages, a single treacherous hill on a rural route, or a power outage can trigger a closure that no weather model would predict.
What Snow Day Calculators Are Good For, and What They're Not
| Good For | Not Good For |
|---|---|
| Getting an early, rough sense of storm severity | Making the final call on whether to send your kid to school |
| Building excitement and awareness the night before a storm | Replacing your school district's official announcement |
| Comparing how a storm looks relative to past ones in your area | Predicting decisions in districts with unusual or inconsistent policies |
| Deciding whether it's worth double-checking the forecast before bed | Planning childcare with total certainty |
How to Use a Snow Day Calculator the Right Way
- Check the night before to get a rough early read, but don't treat it as final.
- Recheck between 5 and 7 a.m., since most districts announce closures in that window and updated forecasts will have refreshed the score.
- Treat anything under 50% as unlikely and anything over 80% as a reasonable, but not guaranteed, signal to start preparing.
- Cross-check with your district's actual history. If your school rarely closes for anything under 6 inches, adjust your expectations accordingly, even if the calculator shows a high percentage.
- Always confirm with your school's official website, app, or social media before making any real plans, since that's the only source with the actual decision.
A Quick Example
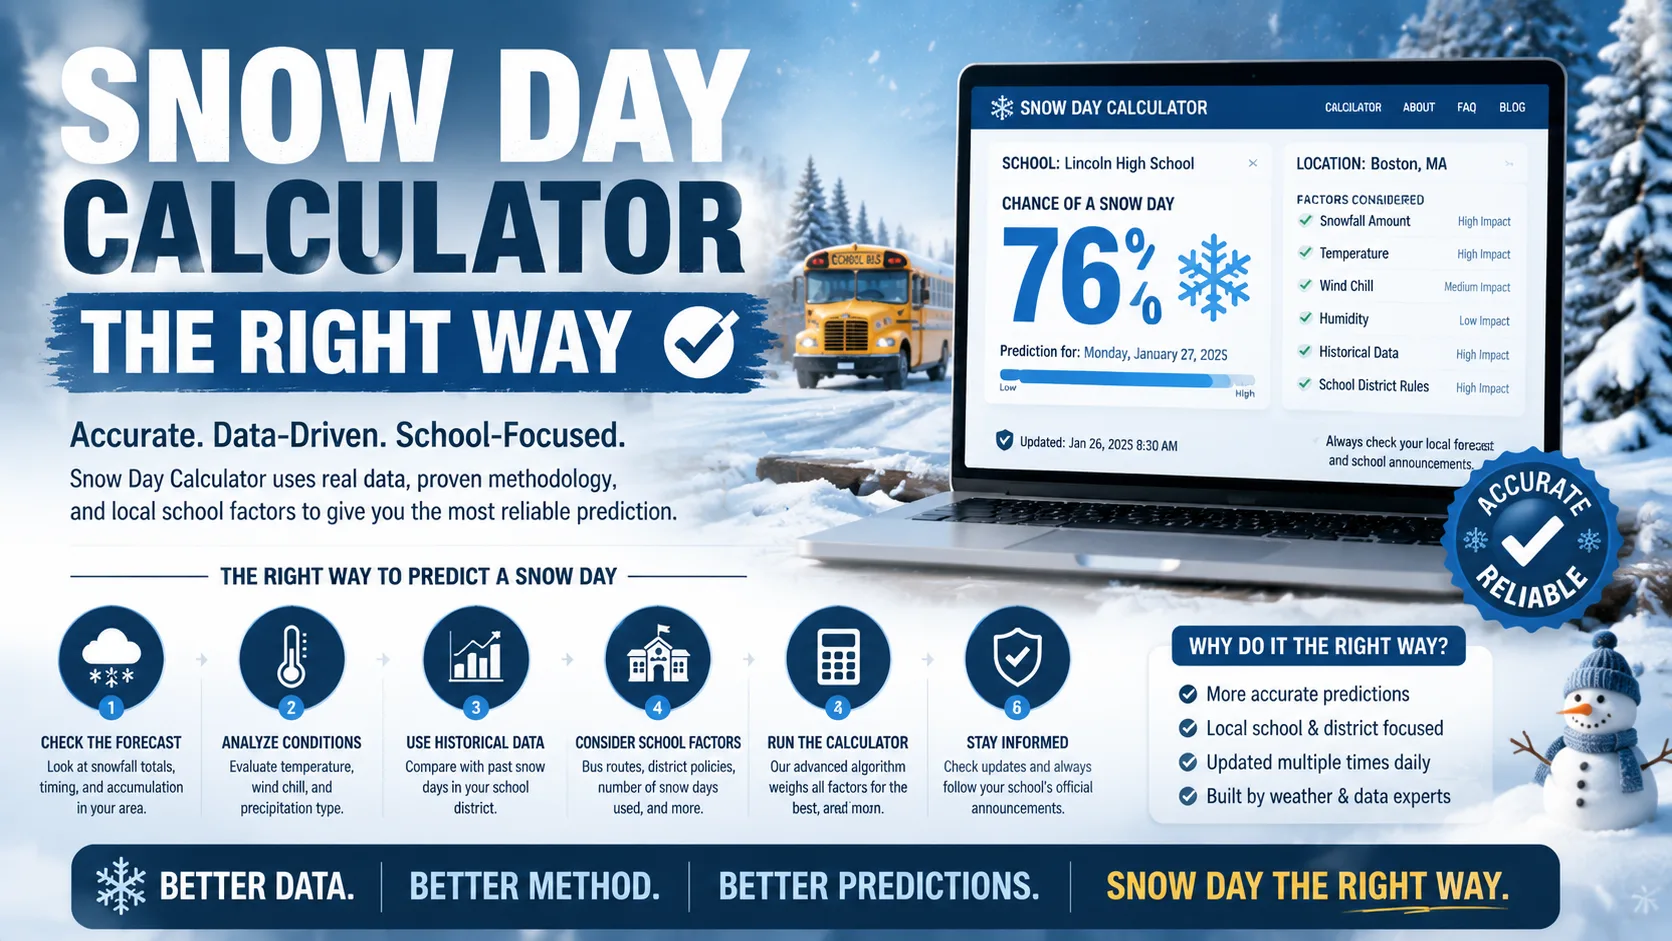
Imagine a calculator shows 78% for your ZIP code the night before a storm. The forecast calls for 5 inches of snow starting at 3 a.m. and stopping by 7 a.m. Historically, your district closes for anything over 4 inches when the storm hits overnight.
In this case, the 78% is a reasonably informed estimate, since the timing and totals line up with your district's known pattern. Compare that to a forecast of 2 inches starting at 8 a.m., where even a 78% prediction should be treated with far more caution, since light daytime snow is exactly the scenario calculators struggle with most.
Read More : Ohio Calamity Day Calculator
Common Mistakes People Make With Snow Day Calculators
- Treating the percentage as a guarantee instead of a probability.
- Ignoring your specific district's historical closure pattern and assuming every school reacts the same way to the same snowfall total.
- Checking once and never again, even though forecasts and scores update as the storm gets closer.
- Skipping the official school announcement entirely and making plans based solely on the calculator.
- Comparing calculators without checking their methodology, since a 98% accuracy claim from one vendor and an 85% claim from another aren't measured the same way.
Conclusion
So, does a snow day calculator work? It works as a weather-based probability tool built on real data, and it can genuinely help you gauge how serious a storm looks before you go to bed. What it can't do is replace the human decision made by your school district the next morning, which depends on local roads, district policy, and judgment calls no algorithm fully captures. Use it for the excitement and the early heads-up, but let your school's official announcement make the final call.
Also Checkout :