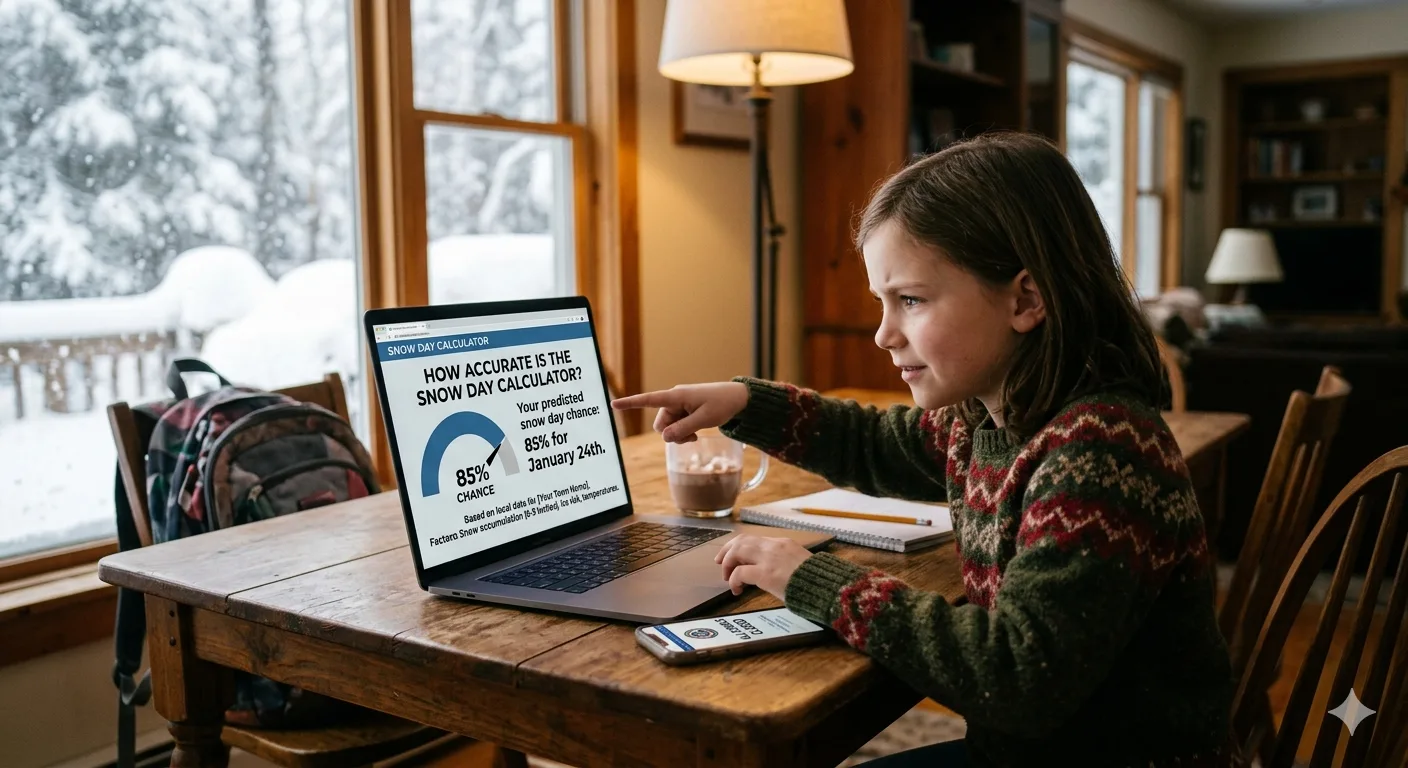
Every winter, millions of students, parents, and teachers refresh the same websites, hoping for those magical words: "High chance of a snow day tomorrow." The Snow Day Calculator has become a cultural institution but just how accurate is the Snow Day Calculator, really?
The short answer: impressively accurate for short-term predictions, significantly less reliable beyond 48 hours and accuracy varies widely by region, snowfall amount, and school district policy.
In this comprehensive guide, we dig into the real numbers behind snow day prediction accuracy, break down exactly how these tools work, examine why they sometimes get it wrong, and give you actionable tips to extract the most reliable prediction possible. Whether you're a curious student or a parent planning childcare, this is everything you need to know.
What Is a Snow Day Calculator?
A Snow Day Calculator is a specialized online prediction tool that estimates the probability of school closures due to winter weather. Unlike a standard weather forecast that simply reports expected snowfall, a snow day predictor goes a step further it combines meteorological data with school district behavior patterns to output a single closure probability percentage.
The original Snow Day Calculator was created by a New Jersey sixth grader named David Sukhin back in 2007. His concept was simple but brilliant: pull real-time weather data from Weather.gov, then combine it with school-specific historical closure data. Over five winters as a student, his calculator never missed a prediction once.
Today, the Snow Day Calculator at snowdaycalculator.com attracts over 5 million users per year, representing more than 100 million yearly page hits. Dozens of competing platforms have launched since, each claiming better AI models and higher accuracy rates. The landscape in 2026 includes tools powered by machine learning, real-time NOAA feeds, and hyperlocal district data.
The Real Accuracy Numbers: What the Data Shows
Accuracy claims from snow day calculator websites range dramatically from a conservative 75% to a bold 98%. The truth sits somewhere in the middle, and it depends heavily on timeframe and conditions. Here is a realistic breakdown based on aggregated data from multiple platforms and independent testing:
📊 Snow Day Calculator Accuracy by Prediction Window
Composite data, 2023–2026 winter seasons* Accuracy rates represent composite ranges from platform self-reporting and independent tracking across U.S. school districts. Individual results vary by location and district policy.
One real-world experiment tracked the Snow Day Calculator across Boston, Minneapolis, and Buffalo during peak winter season. In Boston, the calculator nailed closures 8 out of 10 times when predicting odds above 70%. Minneapolis proved less reliable, as the city's robust snow-handling infrastructure kept schools open despite high predictions. Buffalo produced the most surprises with lake-effect snow causing unexpected closures the calculator failed to anticipate.
The Snow Day Calculator is most reliable when checked 12–24 hours before a potential closure, particularly between 9 PM the night before and 6 AM the morning of. Predictions made 5–7 days in advance are little better than an educated guess and should be treated as early indicators only.
How the Snow Day Calculator Actually Works
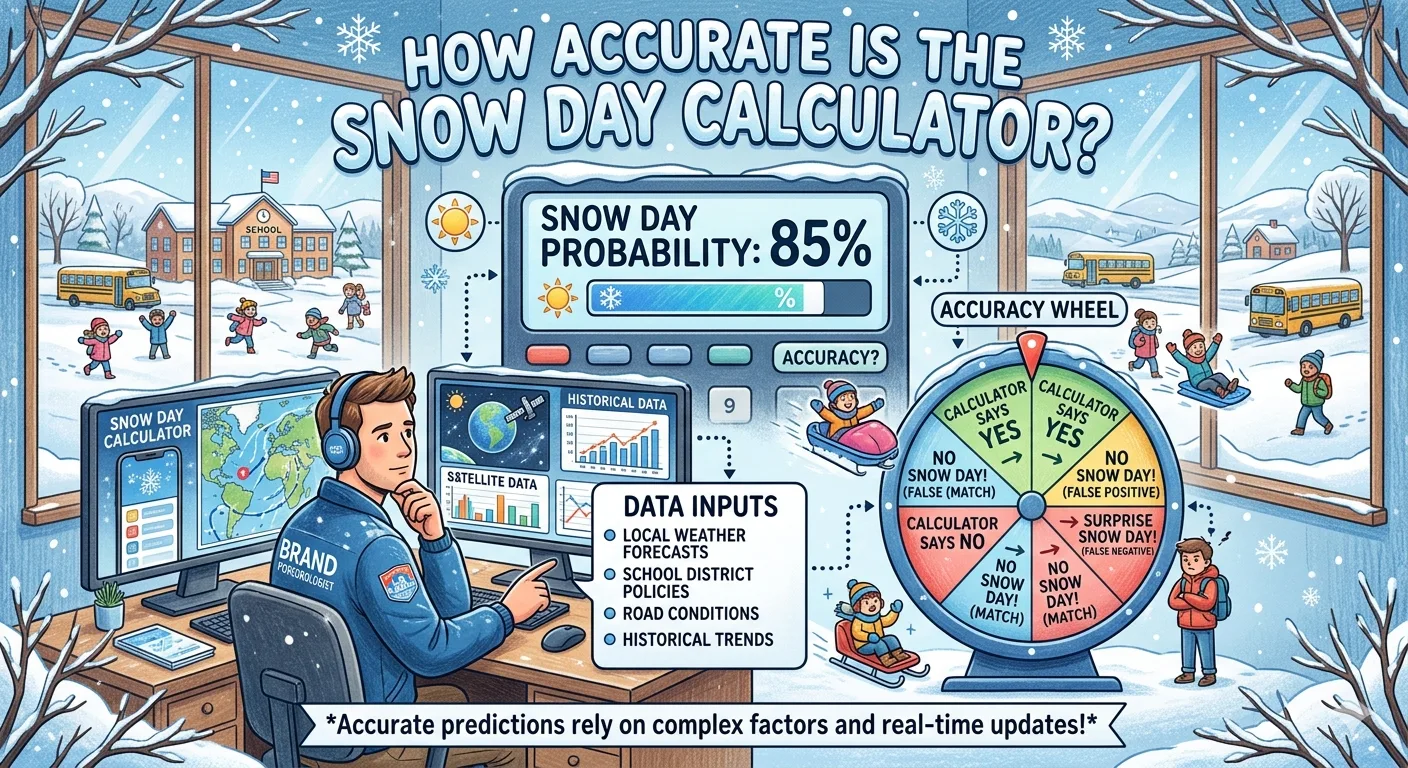
Understanding the mechanics behind snow day predictions helps you interpret results more intelligently. Modern snow day calculators are multi-layered predictive engines, not simple weather lookup tools. Here is what happens when you type in your ZIP code:
Step 1: Real-Time Weather Data Retrieval
The calculator immediately pulls live data from authoritative meteorological sources, primarily the National Oceanic and Atmospheric Administration (NOAA) and National Weather Service (NWS). This includes precipitation type, expected accumulation rates, temperature forecasts, wind chill values, and storm timing relative to school hours.
Step 2: The "Bus Window" Analysis
One of the most critical and often overlooked factors is when the snow falls, not just how much falls. A sophisticated algorithm prioritizes what some platforms call "The Bus Window": the hours between 3:00 AM and 7:00 AM. Snow falling during this window carries a statistically 40% higher likelihood of triggering a school closure than the same amount falling in the afternoon.
Step 3: Regional Infrastructure Coefficient
The algorithm applies a Regional Infrastructure Coefficient to adjust predictions based on local snow-removal capabilities. A southern state like Georgia receives a sensitivity multiplier for even half an inch of ice, while a northern district like Syracuse, New York which averages 127 inches of snow per year requires far more severe conditions before a closure becomes probable.
Step 4: Historical District Pattern Learning
The most advanced calculators use machine learning feedback loops trained on thousands of historical closure decisions. By analyzing how specific superintendents have responded to past storms, the system builds a district-specific "caution profile." It also accounts for modern variables like the increasing use of remote learning days as substitutes for traditional snow days.
Step 5: Final Probability Output
All variables are weighted and scored typically with snowfall accumulation worth up to 35 points, temperature up to 30 points, wind speed up to 15 points, and visibility up to 10 points then converted into a final percentage probability, usually capped at 95% to acknowledge that no prediction can be certain.
6 Key Factors That Determine Snow Day Calculator Accuracy
Snowfall Amount & Timing
6+ inches during morning commute hours dramatically increases closure probability. Timing relative to school hours is often more important than total accumulation.
Ice & Freezing Rain
Even small amounts of ice can cause closures due to dangerous road conditions. Icy roads are actually more dangerous than heavy snow and frequently trigger closures at lower accumulations.
Temperature & Wind Chill
Temperatures below -15°C (5°F) often trigger closures regardless of snowfall. Extreme cold affects bus reliability, student safety at stops, and heating system performance.
School District Policy
Each district has its own closure threshold. Some close at 3 inches; others require 10+. Rural districts cancel earlier due to longer bus routes and less road treatment capacity.
Local Infrastructure
Urban areas with extensive plow fleets clear roads faster. Rural and suburban districts face longer road networks and fewer resources, making closures more likely at lower snowfall levels.
Data Source Quality
Calculators pulling from multiple authoritative sources (NOAA, NWS, regional stations) consistently outperform single-source tools. Real-time updates every 15–60 minutes improve accuracy as conditions evolve.
Regional Accuracy: Why Your Location Changes Everything
The single biggest variable in snow day calculator accuracy is geography. A calculator that achieves 92% accuracy in Buffalo, New York may only hit 65% in Atlanta, Georgia — not because the tool is worse, but because the underlying conditions are fundamentally different.
| Region | Typical Closure Threshold | Avg. Accuracy (24-hr) | Key Challenge |
|---|---|---|---|
| Northeast US (Boston, NYC, Buffalo) | 4–8 inches | 85–92% | Nor'easters shift rapidly |
| Midwest (Minneapolis, Chicago) | 6–12 inches | 80–88% | High infrastructure keeps schools open |
| Southeast US (Atlanta, Charlotte) | 1–3 inches (or ice) | 70–82% | Unpredictable admin decisions |
| Pacific Northwest (Seattle, Portland) | 2–4 inches | 68–78% | Rain-to-snow transitions are hard to model |
| Southern US (Texas, Florida) | Any ice / 0.5+ inches | 60–72% | Rare events with no historical data baseline |
| Canada (Toronto, Montreal, Ottawa) | 15–25+ cm | 82–90% | Lake-effect snow creates localized surprises |
Snow-experienced regions like the Northeast and Midwest have richer historical datasets, more predictable administrator behavior, and better-calibrated infrastructure coefficients. In contrast, regions where snow is rare such as the Deep South have fewer historical closures for the algorithm to learn from, making predictions inherently less reliable.
How Snowfall Amount Affects Prediction Reliability
The relationship between snowfall totals and prediction accuracy is not linear it follows a clear tiered pattern that every user should understand before trusting a percentage.
- Light snow (1–3 inches): Accuracy drops to 55–70%. The margin of error in weather forecasts at this level is itself 1–2 inches, meaning the calculator is working with uncertain inputs. Human discretion plays a large role.
- Moderate snow (4–8 inches): Accuracy improves to 75–85%. Most districts have consistent historical behavior at these levels, giving the algorithm stronger training data.
- Heavy snow (9–12 inches): Accuracy climbs to 88–93%. School closures become near-certain, and the remaining uncertainty comes from road-clearing speed and bus availability.
- Blizzard conditions (12+ inches or whiteout): Accuracy peaks at 93–98%. Near-certain closure territory; the calculator's prediction becomes more of a formality than a forecast.
- Freezing rain / ice storm: High accuracy (85–92%) even with minimal accumulation, because icy roads represent a categorically different safety risk that administrators respond to consistently.
Real Limitations of Snow Day Calculators
Even the most sophisticated snow day predictor has hard limits. Understanding these limitations helps you use the tools wisely rather than treating a prediction as gospel.
Weather Forecast Uncertainty Is the Core Problem
Snow day calculators are only as accurate as the weather data feeding them. Meteorologists themselves achieve roughly 80–90% accuracy on next-day precipitation forecasts and snow is one of the harder phenomena to nail precisely. A storm that was expected to deliver 8 inches can pivot to 2 inches due to subtle shifts in temperature or storm track. When the input data is wrong, the calculator's output will be too.
Human Decision-Making Is Inherently Unpredictable
Superintendents and school boards make closure decisions at 4–6 AM based on real-time road reports, bus driver availability, building heating issues, upcoming testing schedules, and even community pressure. None of these human factors can be fully modeled by an algorithm. A superintendent who skipped a closure last week due to pressure from parents may over-correct and close schools for a milder storm the following week.
The "Remote Learning" Variable
Since the pandemic, many districts now default to virtual learning days instead of traditional snow day closures. This fundamentally changes the closure calculation a district that historically closed 10 times per season might now issue only 3–4 physical closures. Calculators trained on pre-2020 data may systematically overestimate physical closure probabilities for these districts.
Hyperlocal Microclimates
A single school district can span dramatically different terrain. A ZIP code on a hilltop may receive 6 inches while a valley school 3 miles away gets 3 inches. Snow day calculators use ZIP code averages, which can miss these critical local variations that directly influence administrator decisions.
Urban vs. Rural Asymmetry
Rural schools cancel faster and more frequently than urban schools because they have longer bus routes, fewer maintained roads, and less access to emergency snow removal. An algorithm that treats all schools within a county equally will consistently underestimate rural closure probability and overestimate urban closure probability.
How to Get the Most Accurate Snow Day Prediction
You cannot make the calculator more accurate than its design allows, but you can use it strategically to extract the most reliable information available.
✅ 7 Proven Tips for Maximizing Snow Day Prediction Accuracy
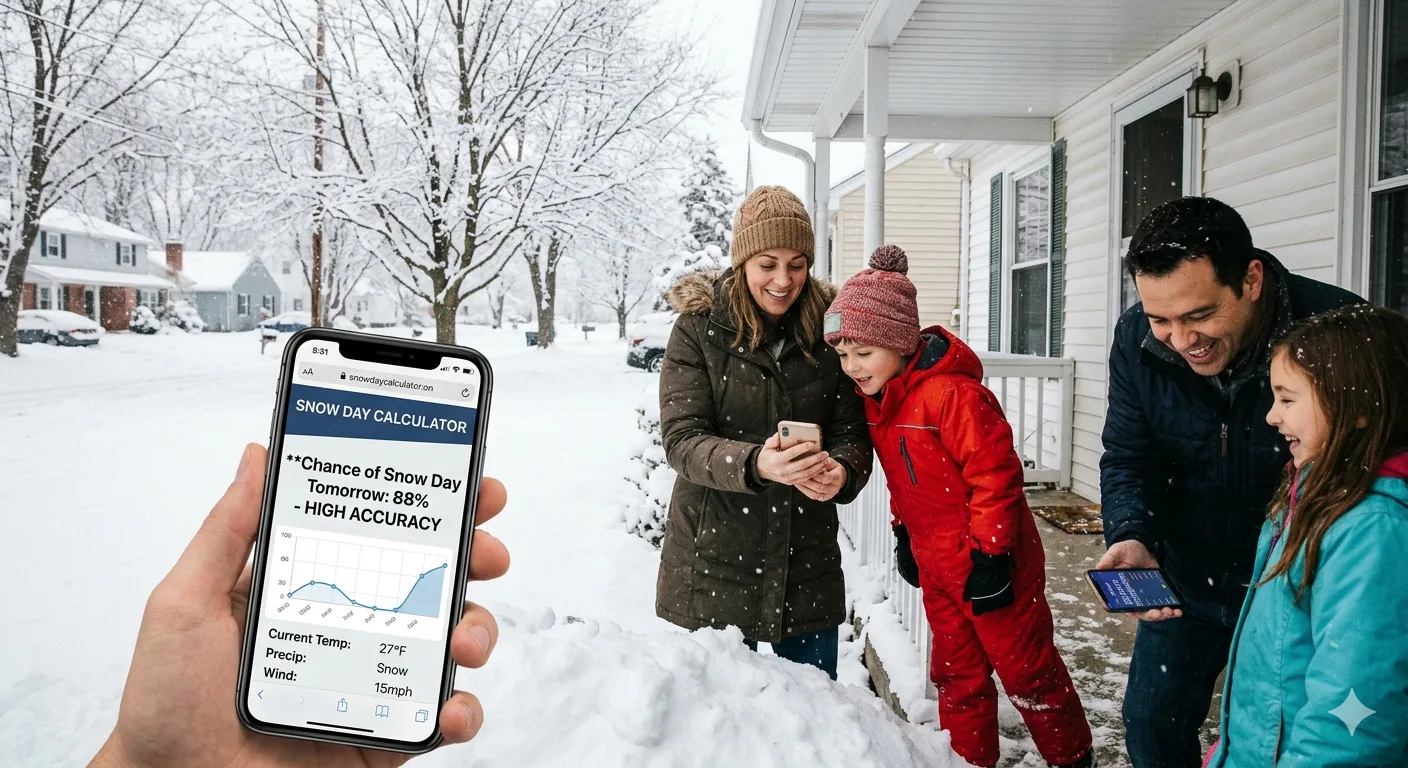
- Check between 9 PM and 6 AM: This is the window when most districts make their preliminary and final closure decisions. Predictions checked during this period reflect the latest weather model runs and are most accurate.
- Use your school's ZIP code, not your home address: If your home and school are in different ZIP codes, the weather conditions at the school location are what matter to administrators.
- Treat predictions below 50% as "unlikely" and above 80% as "probable": The 50–80% range is the high-uncertainty zone where a coin flip is nearly as accurate.
- Refresh multiple times as storm approaches: Predictions improve dramatically as the event gets closer. A 65% reading at 6 PM often becomes an 88% or 25% reading by midnight as the storm track clarifies.
- Cross-reference with a second source: No single calculator is infallible. Checking two or three tools and finding agreement between them strengthens confidence significantly.
- Know your district's historical behavior: If your school has never closed for less than 6 inches in the past five years, discount any prediction below 70% for storms expected to produce 4 inches or fewer.
- Sign up for official district notifications: Use the calculator for early planning, but always confirm with your school district's official alert system email, app, or local news crawl for the final word.
Snow Day Calculator vs. Other Prediction Sources
The Snow Day Calculator does not exist in isolation. Students and parents have several options for gauging closure probability, each with its own strengths and weaknesses.
| Source | Accuracy | Lead Time | Best Used For |
|---|---|---|---|
| Snow Day Calculator (tool) | 85–92% (24 hr) | Up to 7 days | Early probability estimates, planning ahead |
| School District App/Email | 100% (official) | 4–12 hours before | Final confirmation of closure |
| Local TV News | 90%+ | Same morning | Real-time closure announcements |
| NOAA / NWS Forecast | 80–88% | Up to 7 days | Raw weather data without closure interpretation |
| Social Media (school accounts) | 95%+ | 2–8 hours before | Fast, official updates often before websites update |
| Snow Day Superstitions (ice cubes, spoons) | ~50% | N/A | Entertainment value only |
The ideal strategy combines the snow day calculator for early awareness (the night before or even days ahead) with official district communications for final confirmation. Neither replaces the other they serve different points in the decision-making timeline.
Conclusion: Is the Snow Day Calculator Worth Using?
Absolutely with the right expectations. The Snow Day Calculator is not a crystal ball, and no algorithm can perfectly replicate the human judgment of a school superintendent making a 5 AM call during a rapidly evolving storm.
What it is is a remarkably useful probabilistic tool that processes more weather variables than any individual could manually evaluate. When used within 12–24 hours of a predicted storm and interpreted alongside local weather reports, it achieves accuracy rates that genuinely help families plan ahead.
The key rules: trust predictions above 80%, treat anything under 50% as unlikely, always verify with official sources, and never skip setting the alarm just because a calculator said 90%. That remaining 10% has humbled many a hopeful student.
Used wisely, the Snow Day Calculator is one of the smartest free planning tools available for navigating winter disruptions and it only keeps getting better as AI and hyperlocal data modeling continue to improve.
Also Checkout :