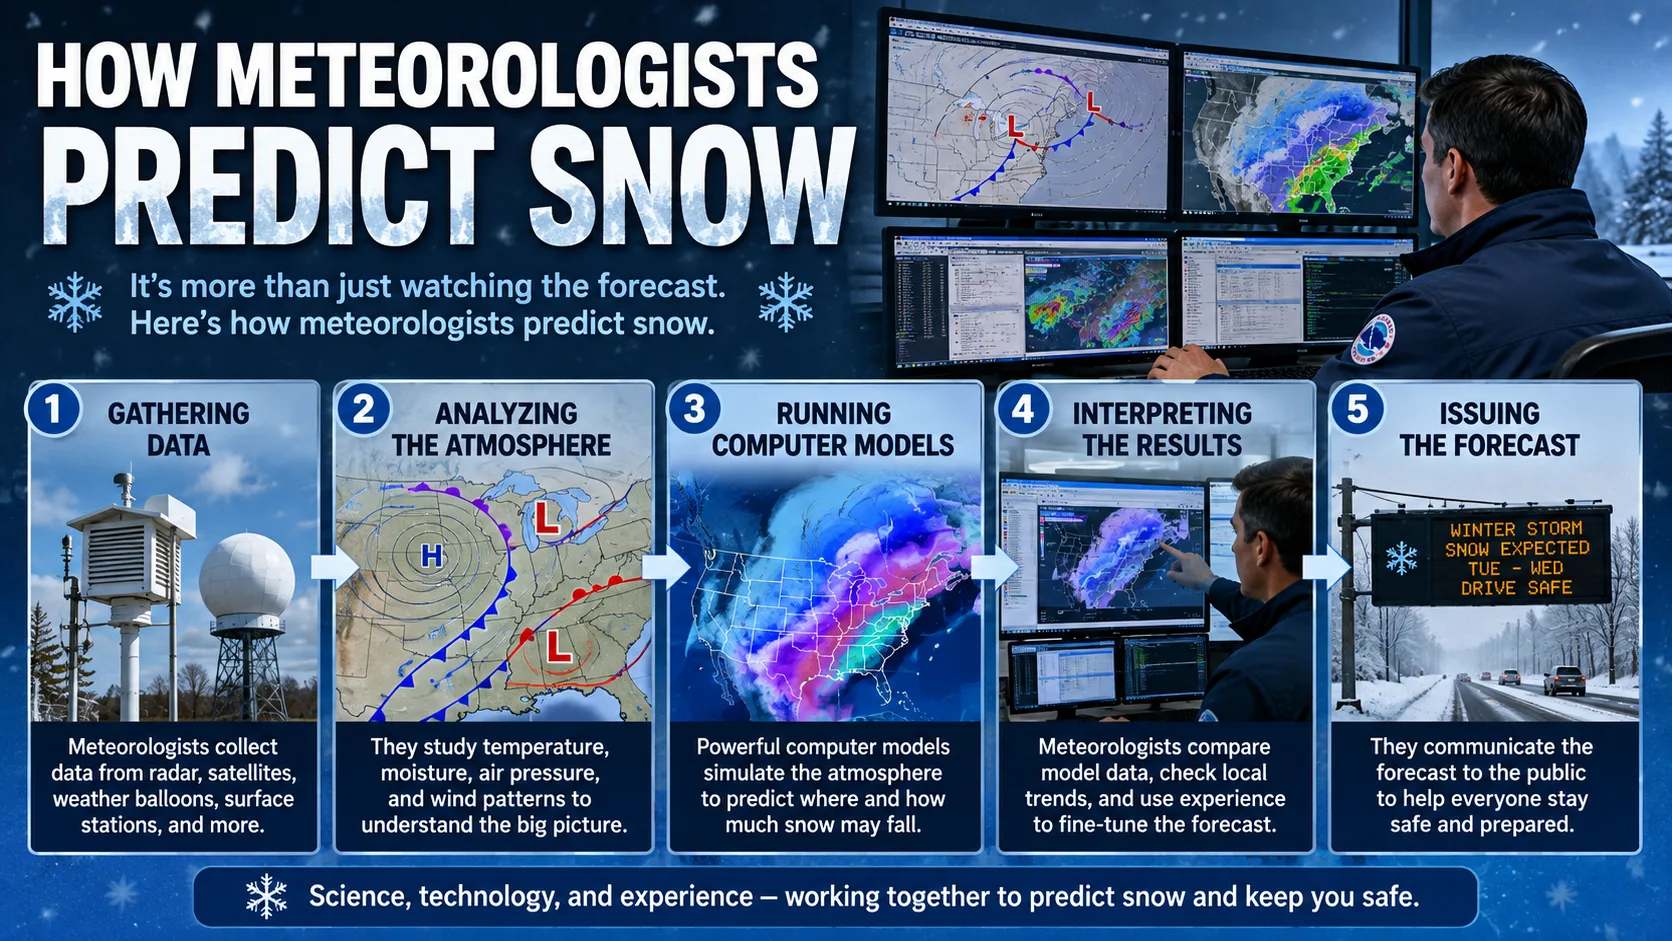
Meteorologists predict snow by combining computer weather models, atmospheric temperature profiles, moisture data, and radar tracking, then applying human judgment to translate that raw data into a snowfall total. No single tool does the job alone. A forecaster blends several data sources, understands where each one tends to be wrong, and adjusts the final number based on experience. That is why two meteorologists looking at the same storm can sometimes land on slightly different totals, and why your local forecast keeps changing in the days before a storm arrives.
If you have ever refreshed a forecast app five times in one evening hoping for a snow day, this guide breaks down exactly what meteorologists look at, the formulas behind the numbers, and how you can use that same information with our snow day calculators to get a clearer picture of what is coming.
What Is Snow Forecasting
Snow forecasting is the process of estimating when precipitation will fall as snow, how much will accumulate, and where. It sits inside the larger field of winter weather forecasting, which also covers ice, sleet, and freezing rain.
Unlike a rain forecast, a snow forecast has to answer two questions instead of one. First, meteorologists must determine whether precipitation will actually fall as snow rather than rain, sleet, or freezing rain. Second, they must estimate how much snow that precipitation will produce once it hits the ground. Getting the first question wrong by even a degree or two of temperature can turn a six-inch snow forecast into a rain event.
Why Snow Is Harder to Predict Than Rain
Rain forecasts only need to nail down how much liquid will fall. Snow forecasts need that same liquid amount, plus an accurate read on temperature at ground level and in the layers of air thousands of feet overhead. A small shift in any of those layers can change snow into sleet, freezing rain, or plain rain.
How Snow Prediction Actually Works
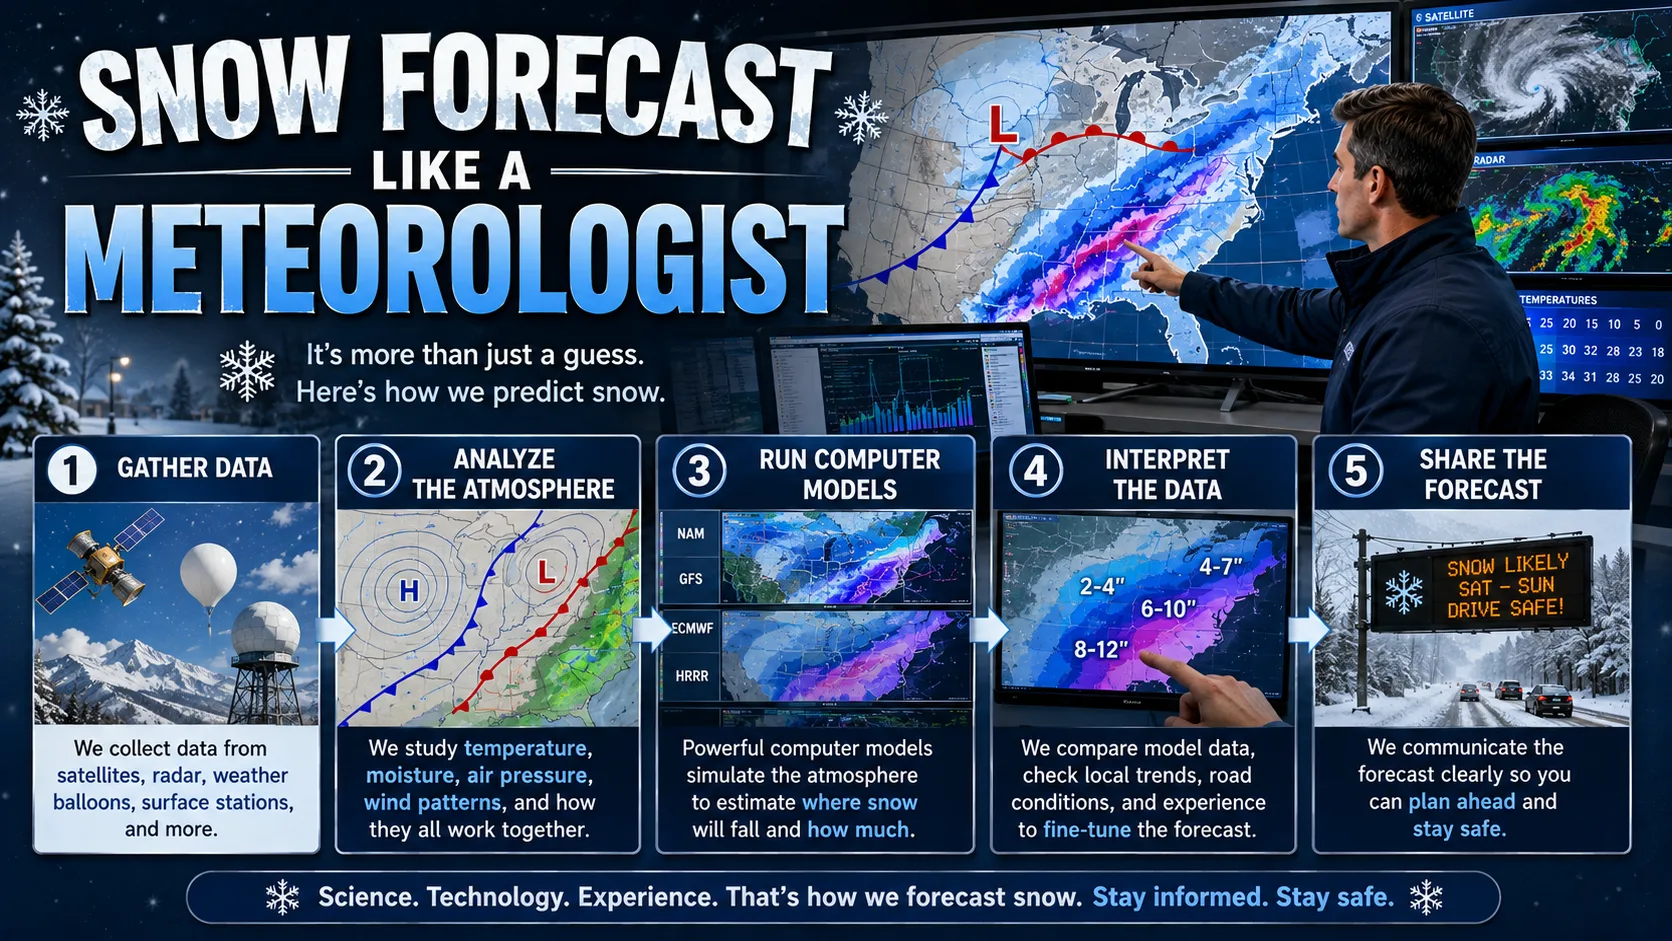
Every modern snow forecast starts with data collection, moves through computer modeling, and ends with a human forecaster applying judgment to the model output. Here is what happens at each stage.
1. Data Collection
Forecasters gather current atmospheric conditions from a mix of sources, including weather balloons, satellites, ground stations, and radar. This data captures temperature, humidity, wind, and pressure at many levels of the atmosphere, not just at the surface.
2. Computer Model Simulations
That raw data feeds into numerical weather prediction models, which are complex simulations of how the atmosphere will evolve over the next several days. The most commonly cited models in the United States are the GFS (American model), the European model (ECMWF), the NAM, and shorter-range high-resolution models. Each model has known strengths and weaknesses, and experienced forecasters learn which model to trust for a given type of storm.
3. Checking the Atmospheric Profile
Meteorologists look at more than just the surface temperature. They examine vertical temperature profiles, sometimes called soundings, which show how temperature changes from the ground up through several thousand feet of atmosphere. A warm layer aloft, even a thin one, can melt snowflakes into rain before they refreeze near the surface as sleet or freezing rain.
4. Tracking the Storm's Path and Speed
Radar and satellite imagery let forecasters track a storm's movement in real time. A slow-moving storm drops snow over a longer window and typically produces higher totals. A fast-moving storm passes quickly and often produces less accumulation, even with similar moisture content.
5. Adjusting for Terrain
Elevation changes snow totals significantly. Higher elevations are colder and can enhance snowfall through a process called upslope flow, where rising air cools and condenses into extra precipitation. This is one reason mountain areas frequently see far more snow than nearby valleys during the same storm.
Key takeaway: A snow forecast is never just one number from a computer. It is a computer model's output, filtered through a meteorologist's understanding of temperature layers, storm speed, and local terrain.
Tools Meteorologists Use Beyond Computer Models
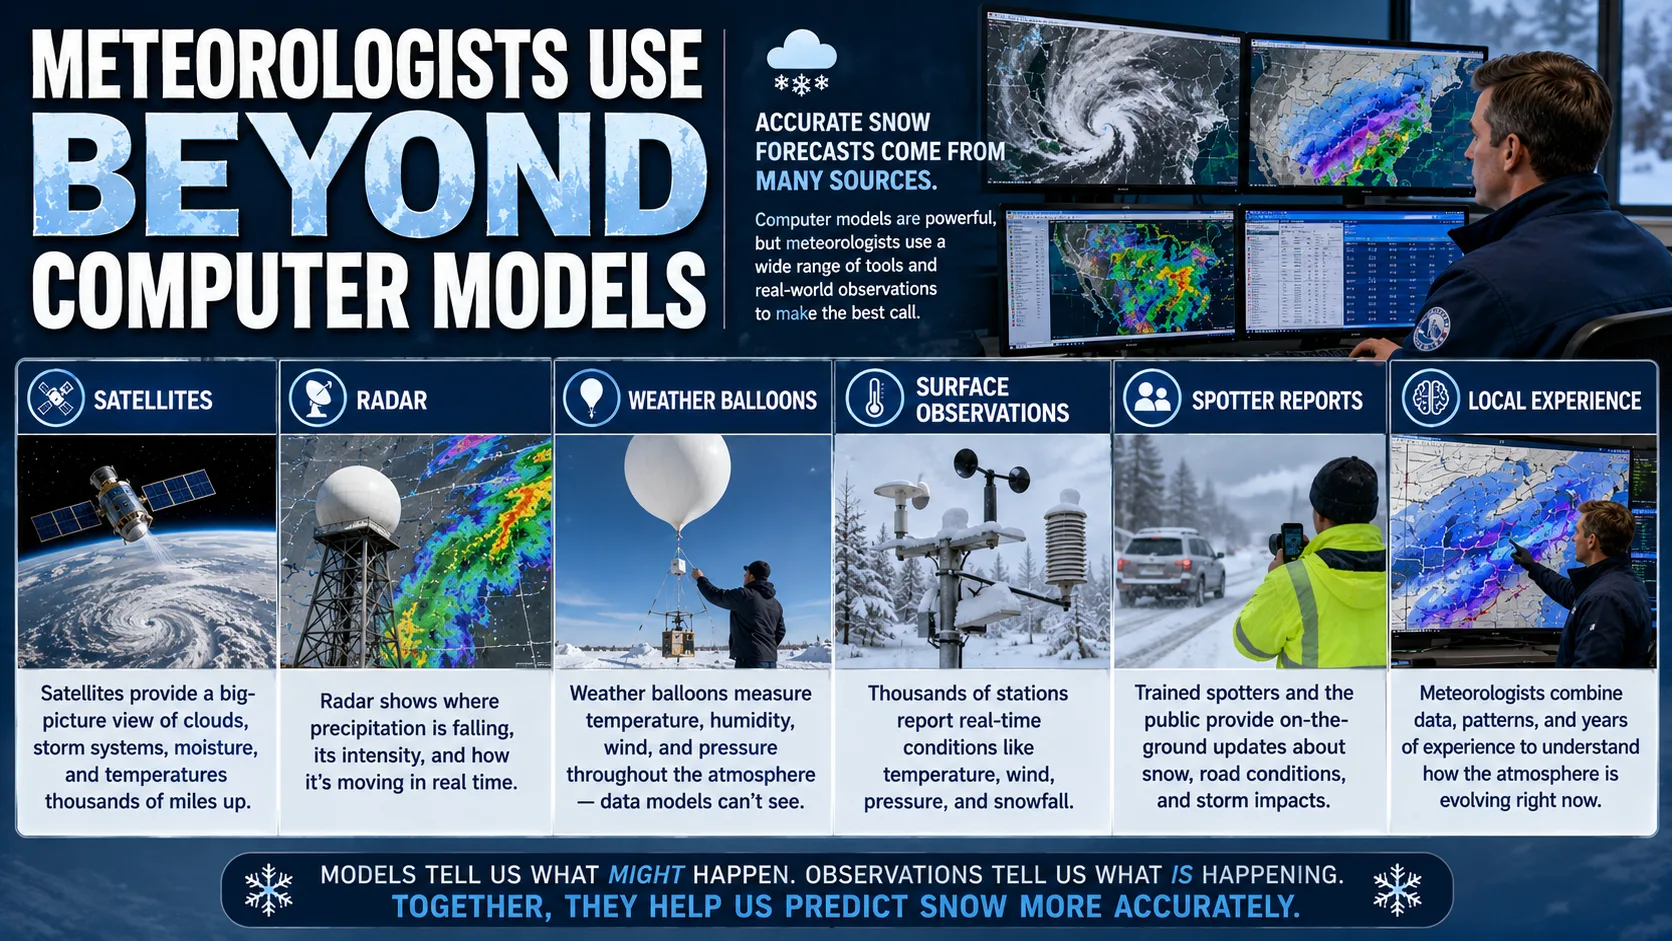
Computer models are only one piece of the puzzle. Forecasters combine several instruments and data sources to build a complete picture of an approaching storm before they commit to a snowfall number.
Doppler Radar
Radar does more than show where precipitation is falling. Dual-polarization radar, now standard across the National Weather Service network, can estimate the shape and size of particles in the atmosphere, which helps forecasters tell the difference between rain, snow, and mixed precipitation in real time as a storm moves through.
Weather Balloons and Soundings
Twice a day, weather balloons launch from stations across the country carrying instruments that measure temperature, humidity, and wind at every level of the atmosphere on the way up. These soundings give forecasters a direct look at the temperature layers that determine whether precipitation will stay frozen all the way to the ground.
Satellite Imagery
Satellites track the broader storm system, including cloud structure and moisture bands, days before a storm arrives. This helps forecasters see the bigger picture: where moisture is concentrated, how fast a system is organizing, and whether it is likely to intensify.
Surface Observation Networks
Thousands of ground stations, airports, and volunteer observer networks report real-time temperature, pressure, and precipitation data. This constant stream of surface data lets forecasters check whether the atmosphere is behaving the way the models predicted, and adjust their forecast if it is not.
Lake-Effect Snow: A Special Case
In areas near large lakes, an entirely different forecasting challenge appears. Cold air moving over relatively warm lake water picks up moisture and heat, then dumps intense, narrow bands of snow downwind. These bands can produce dramatically different totals over just a few miles, and their location depends heavily on the exact wind direction, which is one of the hardest details to pin down precisely in advance.
The Formula: Snow Ratios and the Dendritic Growth Zone
Behind every snowfall total is a calculation meteorologists call the snow ratio, which converts liquid precipitation into an estimated depth of snow.
The Snow Ratio Formula
The basic relationship is:
Snowfall (inches) = Liquid Precipitation (inches) × Snow Ratio
A commonly cited starting point is a 10:1 ratio, meaning 1 inch of liquid precipitation produces roughly 10 inches of snow. But this ratio is not fixed. Research on snow forecasting has found that a straight 10:1 ratio only holds true a fraction of the time, because ice crystal structure, wind, and temperature all change how much air gets trapped inside the snow.
Why Temperature Changes the Ratio
Colder air generally produces fluffier, drier snow with more trapped air, which pushes the ratio higher. As an example, snow falling near 25°F might produce a ratio closer to 15:1, while snow falling in much colder air, well below 0°F, can push ratios toward 40:1 or higher. That means the same amount of liquid precipitation can produce dramatically different snow totals depending on the temperature it falls through.
The Dendritic Growth Zone
A layer of the atmosphere between roughly 10,000 and 20,000 feet, where temperatures sit between about 10°F and 5°F, is especially important. In this range, snowflakes form the elaborate, branching dendrite shapes that trap more air and produce lighter, deeper snow. Meteorologists check whether a storm's moisture is passing through this zone, since it directly affects how "fluffy" or "wet" the resulting snow will be.
Step-by-Step: How to Read a Snow Forecast Like a Meteorologist
- Check the storm track first. Look at where the low-pressure system is projected to travel, since totals can shift sharply if the track moves even 30 to 50 miles.
- Look at the temperature range, not just one number. A forecast near the freezing mark carries more uncertainty than one well below it.
- Note the timing and duration. A storm lasting 12 hours generally drops more snow than one lasting 4 hours, even with similar intensity.
- Compare multiple model runs. If several models agree, confidence is higher. If they diverge, expect the forecast to keep changing.
- Factor in your elevation and location type. Coastal areas, lake-effect zones, and mountain regions all behave differently from open plains.
- Run the numbers through a calculator. Plug the expected snowfall, timing, and local school policy factors into our snow day calculator to see how the forecast translates into real-world odds of a closure or delay.
Why This Matters for Planning Your Week
- Better trip planning: Knowing how snow ratios work helps you judge whether a "light" precipitation forecast could still mean a foot of fluffy snow.
- Smarter school-closure predictions: Understanding storm timing helps you anticipate whether snow will fall during commute hours, which matters more to districts than total accumulation alone.
- More realistic expectations: Recognizing forecast uncertainty keeps you from over-preparing or under-preparing for a storm that shifts at the last minute.
- Faster decision-making: Combining these forecasting basics with our state-by-state snow predictions gives you a localized read instead of a generic regional forecast.
These same forecasting principles apply well beyond snow days. Understanding how meteorologists weigh temperature and timing also helps with related winter planning questions, like whether a storm will bring dangerous wind chill alongside the snow. Our wind chill calculator uses the same underlying temperature and wind data to estimate how conditions will actually feel outside, which matters just as much as the snowfall total when deciding whether it is safe to send kids to the bus stop.
Real-World Examples With Numbers
Example 1: The Freezing-Mark Storm
A storm producing 1 inch of liquid precipitation at 31°F, right at the freezing line, might use closer to an 8:1 ratio because the snow is wet and dense. Result: roughly 8 inches of heavy, wet snow, difficult to shovel and prone to power outages from tree limb damage.
Example 2: The Deep Cold Storm
The same 1 inch of liquid precipitation falling at 5°F might use a 20:1 ratio or higher. Result: roughly 20 inches of light, powdery snow that is easier to move but can drift significantly in wind.
Example 3: The Fast-Mover
A storm with 0.75 inches of liquid precipitation that passes through in just 3 hours may underperform its "on paper" total because there simply is not enough time for full accumulation before temperatures or precipitation type shift.
| Surface Temperature | Typical Snow Ratio | Snow Character | 1 Inch of Liquid Produces |
|---|---|---|---|
| 30°F to 32°F | ~8:1 | Wet, heavy | ~8 inches |
| 25°F to 29°F | ~12:1 to 15:1 | Moderate density | ~12 to 15 inches |
| 15°F to 24°F | ~15:1 to 20:1 | Light, dry | ~15 to 20 inches |
| Below 10°F | ~25:1 to 40:1+ | Very fluffy powder | 25+ inches |
How Accurate Are Snow Forecasts, Really?
Short-range snow forecasts, within about 24 hours of a storm, are generally quite reliable for timing and general severity. Exact accumulation totals for a specific neighborhood are a different story. Even well-run models can be off by several inches once a storm arrives, especially in marginal temperature situations where a one or two degree shift changes precipitation type entirely.
Research into winter weather impacts has also found that even small snowfall amounts carry outsized risk. Analysis of weather-related crash data in Iowa found that a majority of weather-related crashes happened with an inch of snow or less on the ground, underscoring why a "minor" snow forecast still deserves attention even when the total looks unimpressive on paper.
What Meteorologists Say About Forecasting Snow
Snow forecasting is widely considered one of the most difficult tasks in meteorology, largely because of how many small variables can shift the outcome. Spectrum News Chief Meteorologist JD Rudd has described forecasting snow amounts as the single hardest part of his job, noting how much precision is required across multiple layers of the atmosphere.
Spectrum News Chief Meteorologist Eric Elwell has pointed out that surface temperature alone is not enough. What matters more, he explains, is understanding temperature through the full depth of the atmosphere, paired with knowledge of each forecast model's individual biases.
WCCO Chief Meteorologist Chris Shaffer has made a similar point about why snow forecasts draw so much scrutiny compared to rain: people accept a vague rain forecast, but expect precise numbers when snow is involved, even though the science behind snow totals is inherently less exact.
Read More : Temperature and Snowfall Levels That Close Schools
Common Mistakes and Pro Tips
Common Mistakes
- Trusting a single model run: One computer model showing a big snowstorm five or more days out is not a forecast, it is one possibility among many.
- Ignoring the rain-snow line: A storm can produce a sharp cutoff where one town gets a foot of snow and a town 20 miles away gets rain.
- Assuming totals are locked in early: Forecasts several days out should be treated as a range, not a guarantee, since totals typically firm up 24 to 48 hours before the event.
- Overlooking wind: Wind-driven snow can drift dramatically, making the "official" total feel very different depending on where you are standing.
Pro Tips
- Check forecasts every 12 hours in the days leading up to a storm, since models converge as the event gets closer.
- Look at forecast confidence language, not just the number. Phrases like "isolated" or "widespread" carry real meaning.
- Use a dedicated tool like our snow day calculators to translate raw snowfall numbers into a practical closure probability instead of guessing on your own.
Comparing the Major Forecast Models
| Model | Typical Range | Known Strength | Known Weakness |
|---|---|---|---|
| European (ECMWF) | 7 to 10 days | Often praised for medium-range accuracy | Runs less frequently than some US models |
| GFS (American) | 7 to 16 days | Frequent updates, widely available | Can be volatile at longer ranges |
| NAM | 1 to 3 days | Good detail for short-range storms | Loses reliability further out |
| High-resolution models | Hours to 2 days | Captures fine detail like snow bands | Limited to very short time frames |
No single model wins every time. Meteorologists compare all of them, watch how consistent each one has been over the past several runs, and weigh the results with their own experience before publishing a final snowfall forecast.
Conclusion
Predicting snow is part science, part pattern recognition, and part educated judgment. Meteorologists lean on computer models, atmospheric temperature profiles, and storm tracking to build a forecast, then adjust that forecast using experience with how their local weather patterns tend to behave. Understanding the basics behind snow ratios and temperature layers will help you read any snow forecast with a more critical eye. Try the calculator above to turn today's forecast into a real answer for your area.