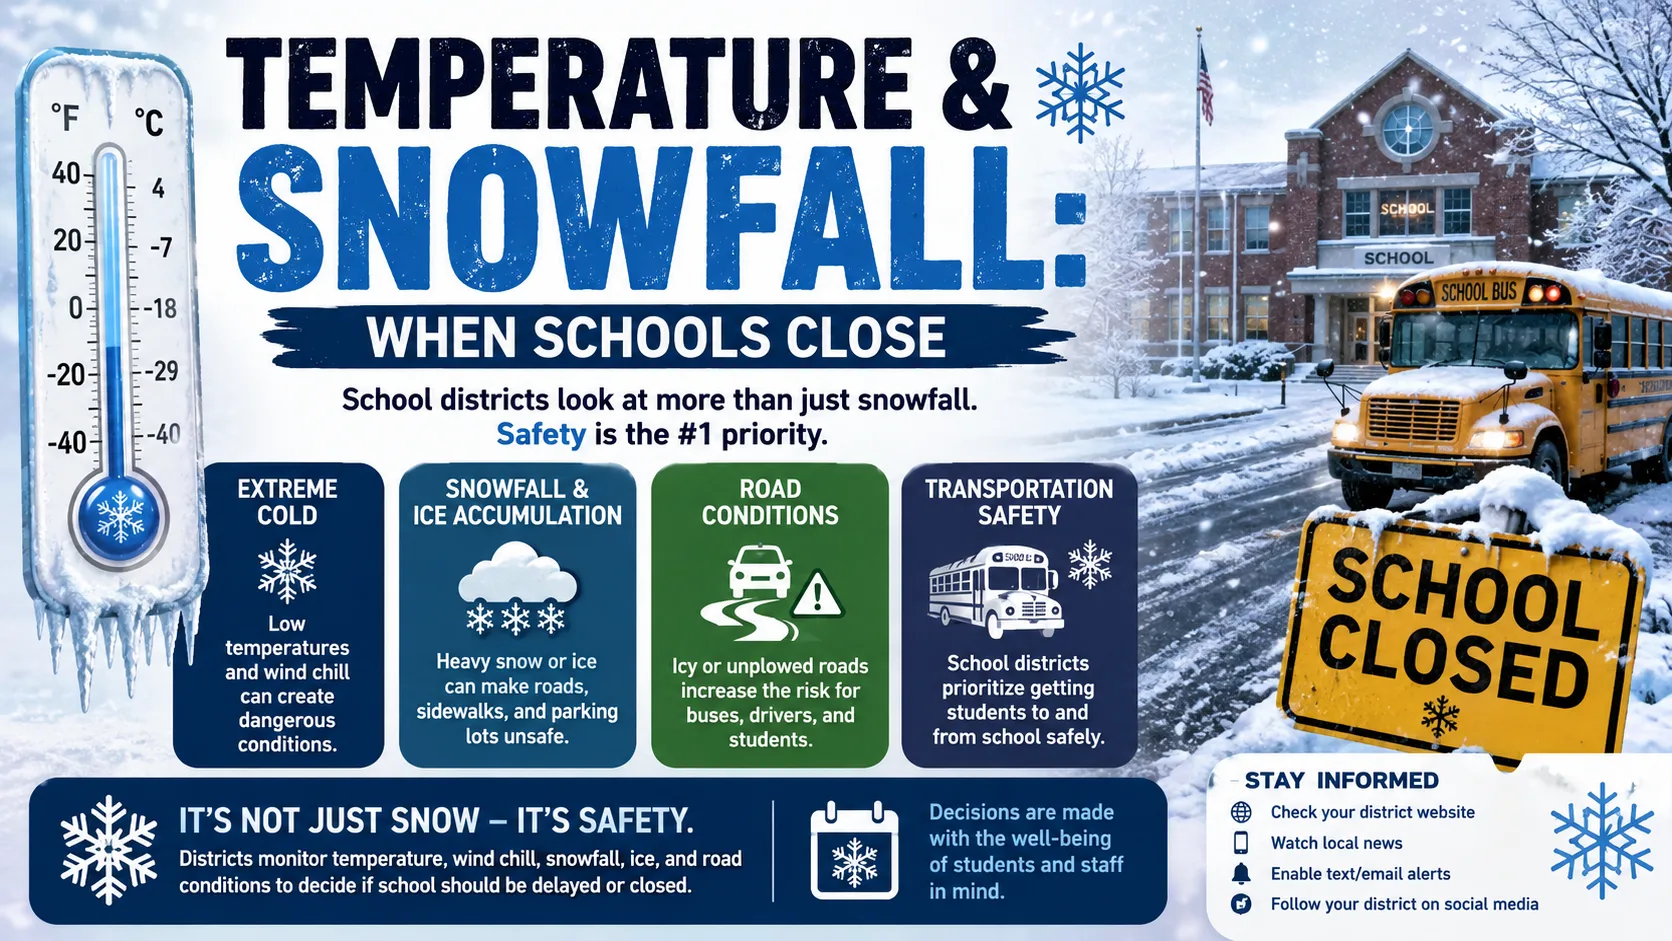
Most schools close somewhere between 2 to 4 inches of snowfall or a wind chill of -15°F to -25°F, though the exact temperature and snowfall thresholds for school closures vary a lot by district, region, and road infrastructure. There is no single national rule. Each district sets its own numbers based on local roads, bus fleets, and winter experience.
This guide breaks down the real thresholds districts use, the formula behind wind chill closures, and how to read a forecast the way a superintendent does. You can also run your own numbers through the snow day calculator above to get a probability score for your ZIP code.
What Is the Temperature and Snowfall Threshold for School Closures
A closure threshold is the combination of snowfall total, temperature, and wind chill that a district uses as a trigger point for canceling class. Districts do not use one shared chart. Instead, each superintendent weighs local conditions against a rough internal guideline.
Generally, the pattern looks like this across the United States:
- 1 to 2 inches of snow can close schools in southern states with little snow removal equipment
- 3 to 4 inches of snow typically closes schools across most of the Midwest and Northeast
- 6 inches or more may be needed to close schools in snow-heavy regions like parts of New England or the Great Lakes snowbelt
- Wind chills of -20°F to -30°F commonly trigger a cold-weather closure even with zero snow on the ground
Ice is treated differently than snow. Many districts report that under half an inch of ice accumulation can force a closure that several inches of dry, fluffy snow would not.
How Snow Day Decisions Actually Work
Superintendents rarely rely on a single number. They combine a forecast with a physical road check, usually starting between 3:00 a.m. and 5:00 a.m., before making a final call by around 6:00 a.m.
A district transportation team typically drives the actual bus routes, including rural and hill roads, rather than trusting the forecast alone. A quiet residential street can look fine while a rural route two miles away is glazed with ice.
This is also why a single county can end up with some districts open and others closed on the same morning. Two neighboring districts might pull weather data from different official stations, cover different terrain, or simply have different superintendents making different judgment calls from the same raw numbers. A district built around a compact town grid faces a very different decision than a rural district with 200 miles of unpaved roads and long bus routes.
Why Some Regions Need More Snow Than Others
Snow tolerance is really an infrastructure question, not just a weather question. A district's threshold reflects how much snow its plow fleet, salt supply, and road crew staffing can realistically clear before the first bus needs to roll.
- Southern and mid-Atlantic districts often own few or no plows, so even 1 to 2 inches can shut down bus routes for a full day.
- Midwest and Great Lakes districts typically run larger fleets and treat roads overnight, pushing the threshold to 3 to 4 inches or more.
- Mountain and snowbelt districts in places like upstate New York or interior New England are built for regular heavy snow, sometimes staying open through 6 to 8 inches if the storm falls during daylight hours with time to plow.
Elevation and hills add another layer. A district with steep grades will often close before a flatter neighboring district gets the same forecast, since buses lose traction faster on inclines, and a single unsafe hill can be enough to cancel an entire route.
The Three Biggest Factors in a Closure Decision
- Timing of snowfall. Snow that falls overnight gives plow crews time to clear roads before buses run. Snow that peaks between 3:00 a.m. and 7:00 a.m. is far more disruptive at the same accumulation.
- Temperature and wind chill. Cold enough conditions can close schools with no snow at all, because of frostbite risk at bus stops.
- Road and infrastructure conditions. Salt supply, hill grades, and rural mileage change how much snow a given district can tolerate before roads become unsafe.
You can compare how these factors stack up in your area using the state-by-state prediction pages, since a district in coastal Georgia and a district in northern Minnesota are working from completely different baselines.
The Wind Chill Formula Behind Cold-Weather Closures
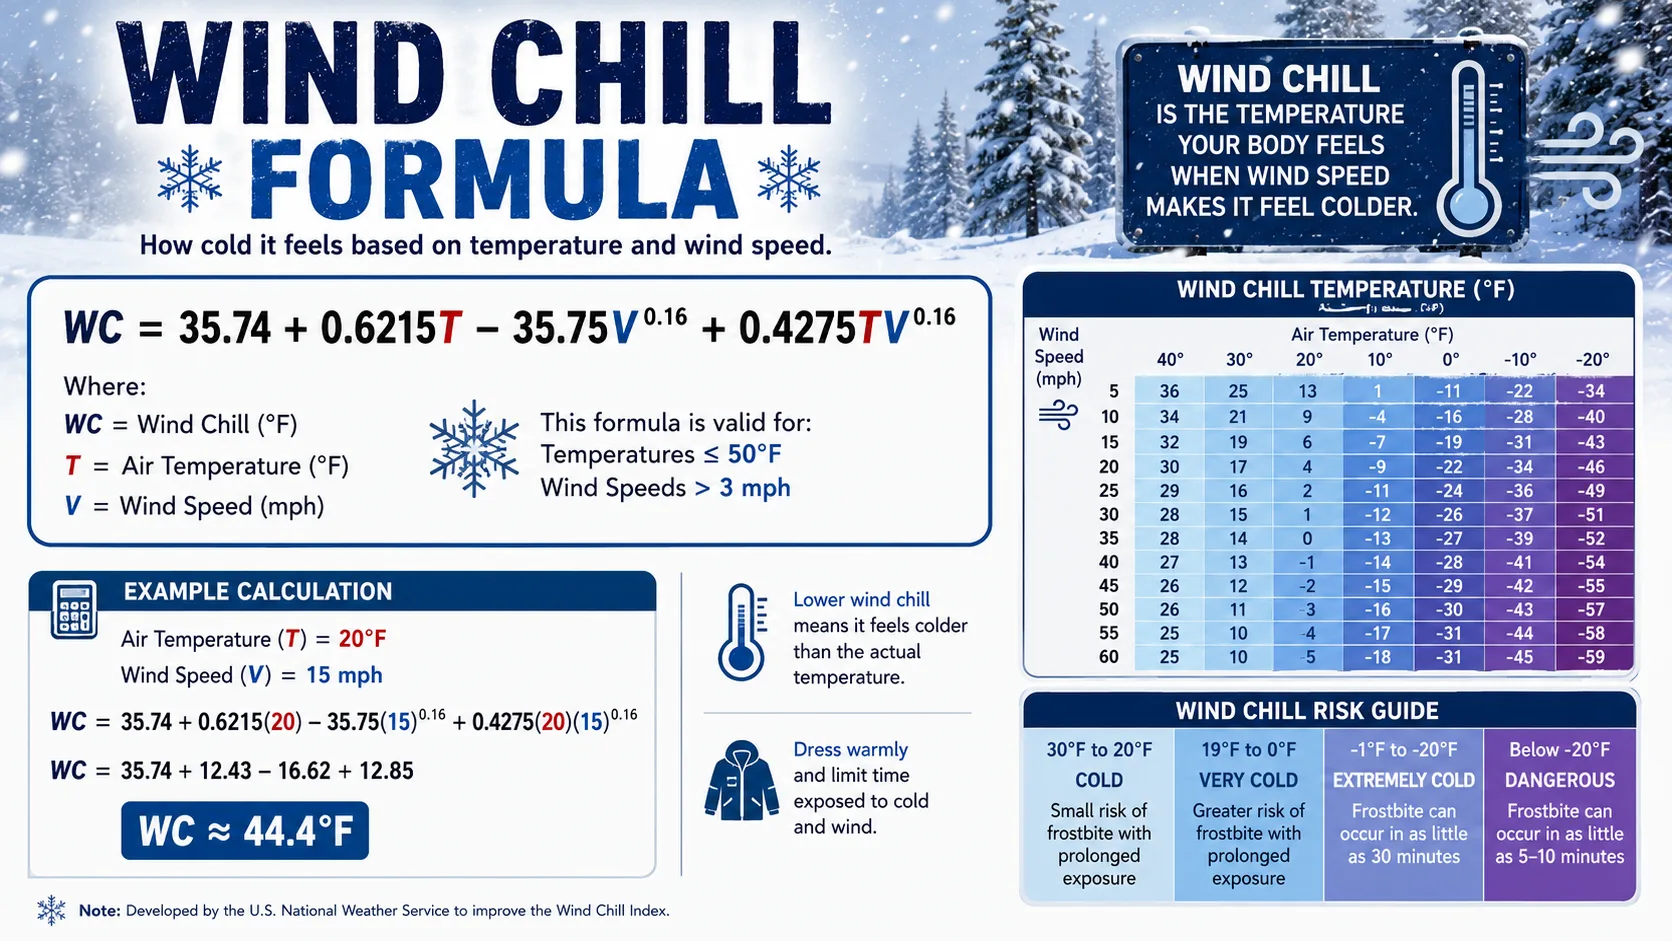
When temperatures drop far enough, wind chill becomes the deciding factor even on a clear, sunny morning. The National Weather Service has used the same official wind chill formula since 2001:
| Variable | Meaning |
|---|---|
| Wind Chill (°F) | = 35.74 + 0.6215T − 35.75(V^0.16) + 0.4275T(V^0.16) |
| T | Air temperature in Fahrenheit |
| V | Wind speed in miles per hour |
| Valid range | Temperatures at or below 50°F, wind speeds above 3 mph |
This formula replaced an older 1945 calculation that overestimated how quickly skin loses heat. Districts pair the resulting number against a frostbite exposure chart, since the real safety concern is how many minutes a child can stand at a bus stop before frostbite risk begins.
You do not need to run this formula by hand. The wind chill calculator does the math instantly from a temperature and wind speed input.
Step-by-Step Guide to Using the Snow Day Calculator
- Enter your ZIP code or city. This pulls a local forecast instead of a regional average.
- Check the expected snowfall total. The calculator weighs total accumulation alongside the timing of the storm.
- Review the temperature and wind chill reading. A dangerously low wind chill can raise the probability score even with light snow.
- Look at the storm timing window. Snow expected between 3:00 a.m. and 7:00 a.m. carries more weight than snow expected the night before.
- Read your probability percentage. Scores above roughly 70% indicate a high likelihood of a closure or delay.
- Check back closer to the morning of the storm. Predictions become more accurate within 24 hours of the event, and most districts announce by 6:00 a.m.
For a full list of related tools, including regional and seasonal calculators, visit the calculator directory.
Real Temperature and Snowfall Thresholds by District
Published district policies show how differently this gets handled from one region to the next. A few real, publicly posted examples:
| District / Region | Cold Weather Closure Threshold |
|---|---|
| Glenview School District 34, Illinois | Classes cancelled at a wind chill of -30°F or colder (with winds over 10 mph) or an actual temperature of -15°F or colder |
| Eau Claire Area School District, Wisconsin | Severe cold defined as a sustained -30°F temperature or a sustained -30°F wind chill |
| Multiple Northeast Ohio districts (2025 arctic blast reporting) | Superintendents generally begin serious closure discussion once wind chills reach double-digit negative numbers, roughly -10°F to -25°F |
| Many Michigan districts | Cold weather advisories trigger consideration once wind chills fall between -15°F and -24°F |
A district communications guide from Lapeer Community Schools in Michigan notes that some districts key off wind chill while others use the actual air temperature instead, which is why the same forecast can close one district and leave a neighboring one open.
Real-World Examples with Numbers
Example 1: Atlanta, Georgia. A forecast of just 1 to 2 inches of snow with temperatures near freezing is enough to close many metro Atlanta schools, since the region has minimal salt supply and plow equipment.
Example 2: Boston, Massachusetts. The same 1 to 2 inch forecast rarely closes Boston-area schools. Districts there are typically built for 6 inches or more before considering a closure.
Example 3: A Midwest cold snap. A morning with clear skies, zero new snowfall, an air temperature of -12°F, and a 15 mph wind produces a wind chill near -35°F using the NWS formula. That single number alone is enough to trigger closure in most districts with a written cold-weather policy, even though no snow fell overnight.
The Rise of Remote Learning Days
A growing number of districts now use a planned remote learning day instead of a traditional snow day, particularly for storms that are visible on the forecast several days out. This lets schools preserve in-person instructional time while still keeping students and staff off dangerous roads.
Remote learning days change how a "closure" should be read. A district issuing a remote day is not closed in the traditional sense, buses simply are not running and instruction continues online. If you are tracking closures for childcare or commuting purposes rather than instructional time, a remote learning day still means no in-person school, so it is worth checking which type of closure your district is announcing, not just whether one was announced at all.
Common Mistakes and Pro Tips
Mistake: comparing your snowfall total to a friend's district in another state. Thresholds are local. Six inches means something completely different in Minneapolis, which is built for it, than it does in Atlanta, which typically is not. A forecast that sounds mild to one family can be a serious closure trigger for another.
Mistake: ignoring wind chill on a morning with no new snow. Cold-only closures catch families off guard every winter, especially across the Midwest and Northeast, because there is nothing visibly falling from the sky to signal danger. The temperature and wind speed alone can be enough.
Mistake: checking the forecast too early and treating it as final. Predictions firm up significantly within 24 hours of a storm. A Sunday-night guess for a Wednesday storm is far less reliable than a Tuesday-night check for the same Wednesday, since storm tracks and snow totals can shift substantially in three days.
Mistake: assuming a closure automatically means no schoolwork. With remote learning days becoming more common, a canceled bus route does not always mean a canceled school day.
Pro tip: watch the 3:00 a.m. to 7:00 a.m. window specifically. This is the single heaviest-weighted factor in most closure algorithms, since it determines whether plow crews had time to clear routes before buses run.
Pro tip: check your specific district's published policy once per season. Many districts post their exact temperature and wind chill numbers on their website, which removes most of the guesswork and lets you compare tomorrow's forecast directly against your district's own trigger points.

How Snowfall and Temperature Thresholds Compare Across Closure Triggers
| Trigger | Typical Threshold | How Fast It Can Force a Closure |
|---|---|---|
| Snowfall accumulation | 1 to 6+ inches, depending on region | Gradual, tied to plowing capacity and timing |
| Ice accumulation | Under 0.5 inches in many districts | Fast, even small amounts create hazardous roads |
| Wind chill | -15°F to -35°F, depending on district | Immediate, based on frostbite exposure time |
| Actual air temperature | -5°F to -15°F in districts that skip wind chill |
Immediate, used by districts without a wind chill policy |
Reading a Forecast Like a Superintendent
Families checking the forecast usually look at one number, the total snowfall. Superintendents and transportation directors look at several numbers stacked together, and the combination matters more than any single figure.
A useful way to think about it is as a short checklist rather than one score:
- What time does precipitation start and end? A storm that wraps up by midnight gives crews hours to clear roads. A storm still falling at 6:00 a.m. does not.
- Is it snow, sleet, freezing rain, or a mix? Freezing rain and sleet create ice layers that are far more dangerous than dry snow at the same accumulation.
- What is the wind doing? Even a modest snowfall can drift into impassable roads and reduced visibility if wind speeds climb past 20 to 25 mph.
- What did the roads look like at the last check? Many districts run their final decision off an actual overnight road inspection, not just a forecast model.
- What is the temperature trend, not just the current reading? A morning that starts at 28°F and is expected to drop through the day behaves very differently on the roads than one that starts at 28°F and is expected to warm up.
Running your own forecast through these same factors, snowfall, ice, wind, timing, and temperature trend, is essentially what the calculator above automates for you.
Read More : How Shoveling Snow Is Dangerous
How Makeup Days and State Rules Factor In
Temperature and snowfall thresholds do not exist in isolation. They are also shaped by how forgiving a state is about makeup days, since a district with generous built-in snow days is often willing to close at a lower threshold than a district that is already tight on its calendar.
Some states set a fixed number of emergency closure days a district can use before it must extend the school year or add days to breaks. Once a district uses up that allowance, superintendents tend to raise their internal bar for the next storm, waiting for more clearly dangerous conditions before canceling class again.
Districts that lean on remote learning for closure days often sidestep this pressure entirely, since instructional time technically continues even though buildings are closed. That is part of why remote learning options have expanded so quickly in districts that used to burn through their allotted snow days by February in a heavy winter.
Try It Yourself
Every district weighs temperature and snowfall a little differently, so the fastest way to get a real answer for your area is to run your own forecast through the snow day calculator above. For deeper reading on related winter weather topics, browse the blog for guides on wind chill, rain delays, and regional snow patterns.