
A school closing calculator is a free online tool that estimates the chance your school will close, delay, or dismiss early because of winter weather. It looks at your local forecast, your school's location, and known closure patterns to give you a probability instead of a guess. You enter your ZIP code or city, and the calculator does the rest in seconds.
If you have ever refreshed a weather app at 9 p.m. trying to guess tomorrow's forecast, this tool was built for you. Below, we explain exactly how it works, walk through the math behind the prediction, and show you how to read the results like a pro. You can try the live tool on our School Snow Day Calculator homepage while you read.
What Is a School Closing Calculator
A school closing calculator is a prediction tool, not an official source. It combines live weather forecast data with information about your specific school district to estimate the odds of a closure, delay, or early dismissal. Think of it as a weather-informed probability score built specifically for the school closure decision, rather than a general-purpose forecast.
Unlike a standard weather app, a true school closing calculator does more than report snowfall totals. It factors in things a weather app ignores, such as:
- How your specific district has historically responded to similar storms
- Whether your area is rural, suburban, or urban (which changes plowing speed and bus route length)
- Ice accumulation, which is often more disruptive than snow depth alone
- Wind chill at the exact hours students wait for buses
- How many snow days your district has already used this school year
The result is a single, easy-to-read percentage or verdict, something like "72% likely" or "moderate chance of a two-hour delay," instead of raw meteorological data you would otherwise have to interpret yourself.
This matters because the same weather event can mean completely different things in different places. A superintendent in Minnesota and a superintendent in Georgia are looking at very different closure thresholds, even if their local forecasts both mention "snow." A national weather forecast tells you what the sky is doing. A school closing calculator tells you what that weather is likely to mean for your specific school.
Most tools also distinguish between three separate outcomes, since they are not the same decision for a district: a full closure, a delayed opening (often one to two hours), and an early dismissal. Some calculators report a single combined probability, while more detailed tools break the odds down by outcome type, which is useful if your main concern is, for example, whether your bus will still run on a delayed schedule.
Key takeaway: A school closing calculator estimates probability. It does not replace your district's official announcement. Always confirm with your school's website, app, or automated call before making final plans.
How Does a School Closing Calculator Work
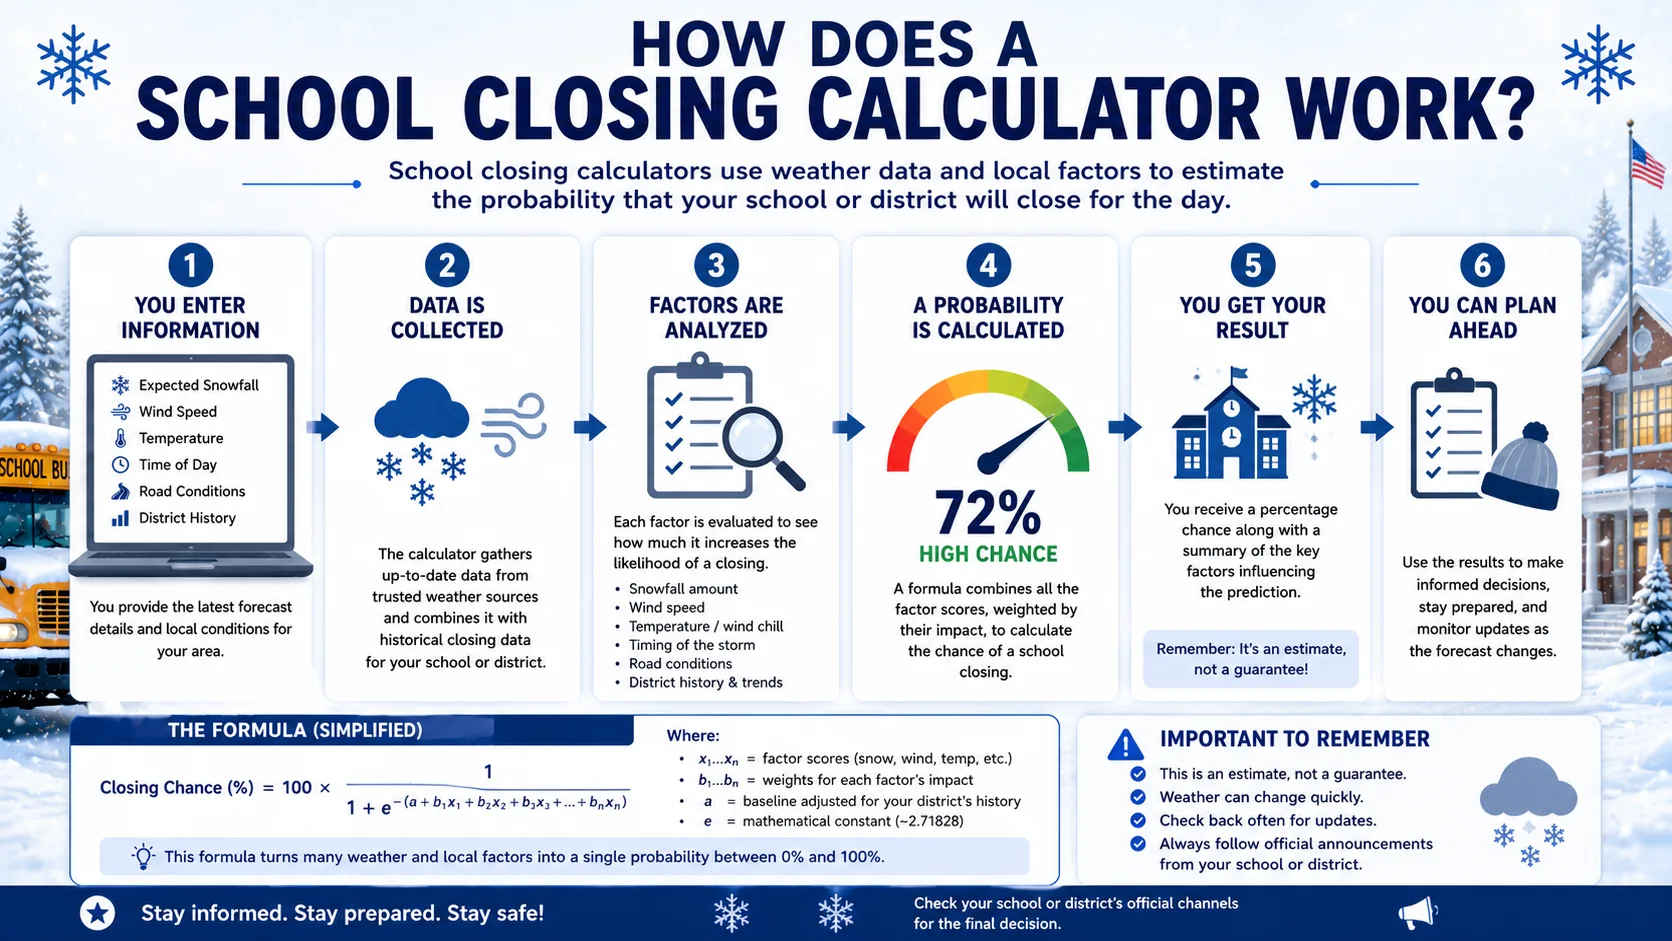
Most school closing calculators pull live data from national weather sources, then run that data through a scoring model built around the factors that actually influence a superintendent's decision. Here is the general process.
Step 1: Weather Data Collection
The tool retrieves the current forecast for your exact location, including expected snowfall, ice accumulation, temperature, and wind speed. Because forecasts change quickly, this data typically refreshes every few hours, and accuracy improves as the storm gets closer.
Step 2: Local Context Layer
The calculator adds context that a raw forecast cannot provide on its own. This includes your district's typical closure threshold, road infrastructure, and how many closures the district has already used this year. A district close to its state-mandated minimum instructional days may be more reluctant to close, even in similar weather.
Step 3: Weighted Scoring
Each factor is scored and combined using a weighted formula, described in detail in the next section. The output is a single probability, usually shown as a percentage alongside a plain-language verdict such as "likely closure" or "unlikely."
The Formula Behind the Prediction
There is no single official, government-issued formula for predicting a snow day. School closure decisions are made by individual superintendents, often the night before or early the same morning. What a school closing calculator does is model the same factors those decision-makers weigh, using publicly available weather data and historical closure patterns.
A simplified version of the weighting used by most modern calculators looks like this:
| Factor | Approximate Weight | Why It Matters |
|---|---|---|
| Snowfall total | 30 to 35% | The single largest driver of closure decisions nationwide |
| Ice accumulation | 15 to 20% | Even a thin layer of ice makes roads and sidewalks unsafe |
| Temperature and wind chill | 15% | Extreme cold can trigger closures with little or no snow |
| Storm timing | 10 to 12% | Overnight snow during the morning commute causes more closures than daytime snow |
| District closure history | 10% | Some districts close early and often; others rarely close at all |
| Infrastructure (plows, buses, terrain) | 5% | A city with hundreds of plows clears roads faster than a rural county with a handful |
| Active weather alerts | 3 to 5% | Winter storm warnings and travel advisories add confidence to the score |
The National Weather Service, along with Environment and Climate Change Canada for Canadian users, is the type of source these calculators typically pull raw forecast data from before applying their own scoring model.
Because this weighting is a heuristic model and not an official government standard, results can vary between tools. That is normal. Treat the percentage as an informed estimate, not a guarantee.
Step 4: Confidence and Freshness
Good calculators also track how confident the underlying forecast model is. A storm 12 hours away with a tight, well-agreed forecast produces a more reliable score than one five days out, where different weather models can still disagree by several inches. This is why the same storm can show a 40% chance on Monday and a 75% chance by Thursday night, even though nothing about the actual weather event has changed. The forecast simply became more certain as the storm approached.
How Calculators Validate Their Predictions
A trustworthy school closing calculator does not just guess and move on. Reputable tools track their own predictions against real closure announcements scraped from district websites, local news, and automated call systems, then use that record to refine the model season over season.
This is also why accuracy figures are usually given as a range rather than a single number. A tool might report 85% to 92% accuracy for predictions made within 24 hours of a storm, and a lower 70% to 80% range for predictions made three to five days out. The gap exists because short-range weather forecasting is simply more reliable than long-range forecasting, regardless of how good the closure model itself is.
It is worth remembering that no calculator can account for a superintendent's last-minute judgment call. Two neighboring districts can look at identical weather data and reach opposite decisions based on local politics, road crew availability, or even a single icy hill near a school. A calculator narrows the odds. It cannot read a superintendent's mind. Think of the score as your starting point for planning, not your final answer, and you will get the most reliable use out of the tool all winter long.
Step-by-Step: How to Use a School Closing Calculator
Using a school closing calculator takes less than a minute. Here is the typical process on our full calculator directory.
- Enter your location. Type your ZIP code, city, or postal code, or allow the tool to detect your location automatically.
- Confirm your school type. Select K-12, public, private, or college, since closure thresholds differ by institution type.
- Review the live weather pulled in. The calculator will display expected snowfall, ice, temperature, and wind for your area.
- Check your district's typical response. If your calculator supports it, choose whether your district tends to close early ("liberal") or stay open through most storms ("conservative").
- Read your probability score. You will get a percentage along with a plain-language verdict.
- Check again closer to the storm. Predictions made the evening before or early the same morning are typically the most reliable, since short-range forecasts are more accurate than long-range ones.
For state-specific closure patterns and typical snowfall thresholds by region, our state-by-state prediction page breaks down how much snow it actually takes to close schools where you live.
Key Closure Factors at a Glance
Not every inch of snow is equal. The same forecast can produce completely different outcomes depending on where you live. Here is a quick regional comparison.
| Region Type | Example Area | Typical Snowfall Threshold |
|---|---|---|
| Southern, low snow infrastructure | Atlanta, Georgia | 1 to 2 inches |
| Mid-Atlantic, moderate infrastructure | Richmond, Virginia | 3 to 4 inches |
| Northern, high infrastructure | Boston, Massachusetts | 6 or more inches |
| Northern, extreme snow regions | Minneapolis, Minnesota | 8 or more inches, or extreme wind chill |
This is exactly why a school closing calculator checks your exact ZIP code instead of applying one national average. A forecast that shuts down schools in Georgia might barely register in Minnesota.
Real-World Examples With Numbers
Seeing the formula applied to real numbers makes the concept easier to trust. Here are two example scenarios.
Example 1: Suburban District, Mid-Winter Storm
A suburban district expects 6 inches of overnight snow, a low of 22°F, and 12 mph winds in mid-January.
- Snowfall: 6 inches contributes roughly 30 points
- Temperature band (18 to 25°F): adds roughly 12 points
- Wind: adds roughly 5 points
- Region and season: neutral, no adjustment
Combined with a small base score, this scenario lands around a 50 to 55% probability, essentially a coin flip that leans toward closure.
Example 2: Rural District, Early Season Storm
The same storm hits a rural district in early November, before road crews have settled into their winter routine.
Because rural districts and early-season storms both add extra points in most models, this scenario often lands closer to a 70% probability, even though the weather itself is identical to Example 1. Community infrastructure and timing in the school year change the outcome as much as the storm does.
Example 3: Urban District, Ice Storm in Late Winter
An urban district expects only 1 inch of snow, but a quarter inch of freezing rain, with temperatures hovering right around 32°F in late February.
Snowfall alone would barely register here. But ice accumulation typically carries a heavier weight than snow depth in most models, since even a thin glaze makes sidewalks, bus steps, and parking lots dangerous. Add a well-established, snow-experienced district that has already used several closures this year, and this scenario often still lands in the 45 to 60% range, despite the low snow total. This is a good example of why checking raw snowfall alone can be misleading.
Who Uses a School Closing Calculator, and Why
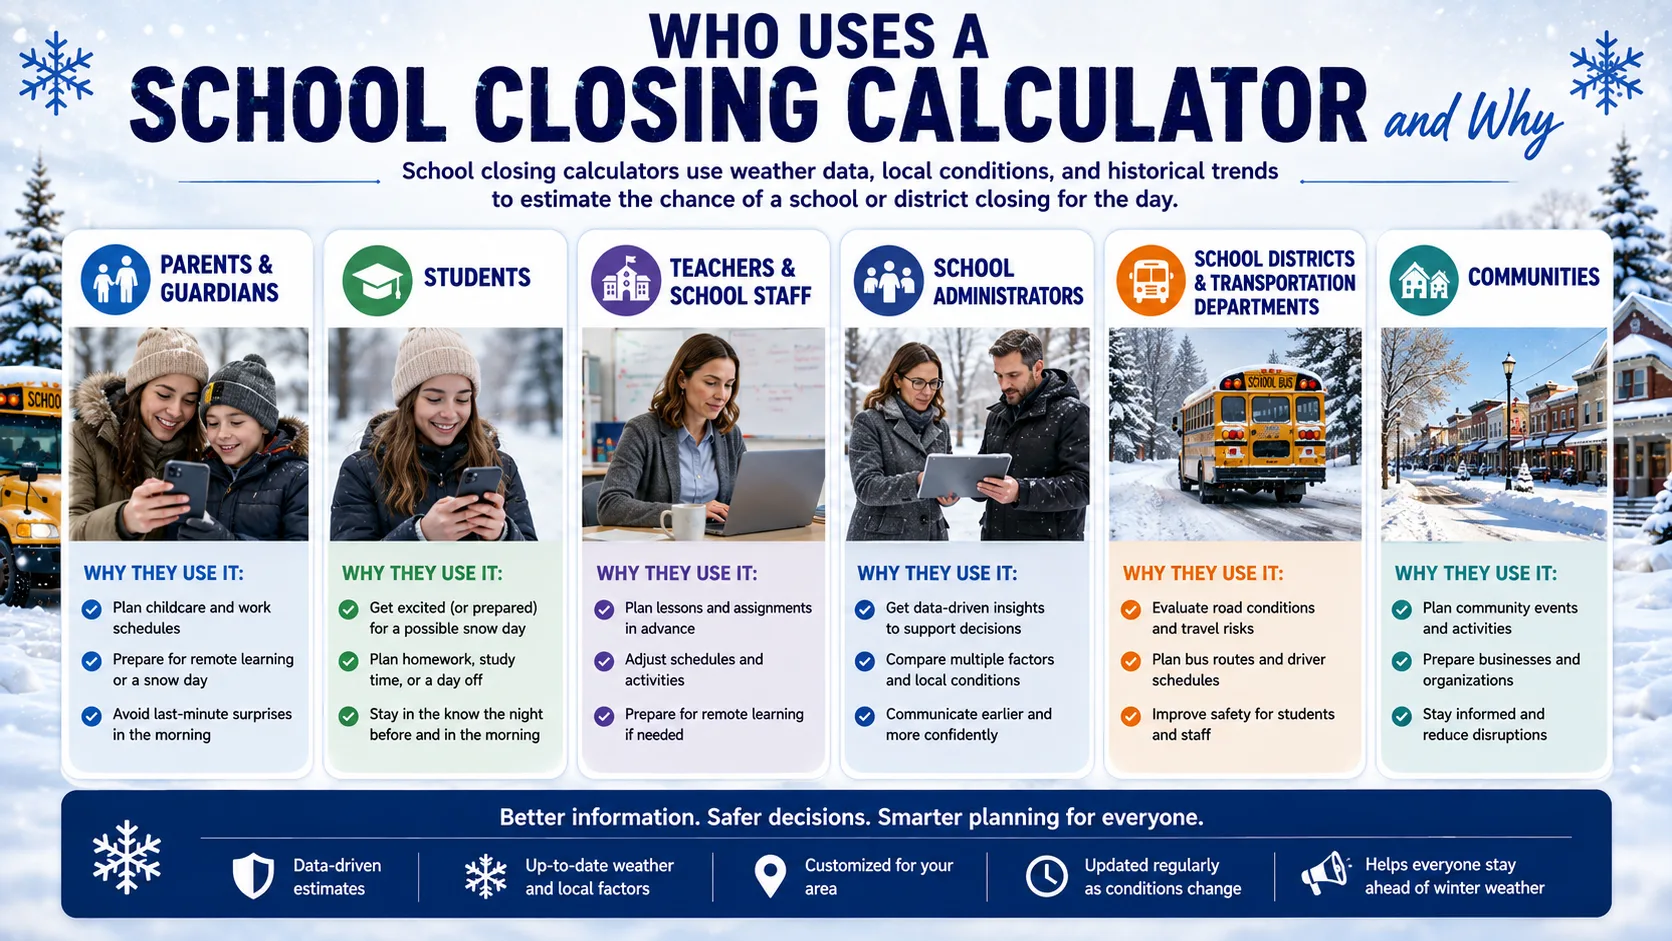
A school closing calculator is useful for anyone whose schedule depends on whether school opens tomorrow.
- Parents and caregivers use it to arrange childcare or adjust morning routines before a storm hits. Lining up a babysitter or checking in with a grandparent the night before is much easier with even a rough probability than with no warning at all.
- Students use it to plan study time, extracurriculars, or transportation, especially before exams, games, or after-school jobs that depend on a normal schedule.
- Teachers use it to prepare lesson plans that can shift quickly if a delay or closure is likely, so a lost instructional day does not derail an entire unit.
- Bus drivers and school staff use it to plan routes and arrival times around road conditions, particularly on rural routes where a single icy stretch can affect the whole schedule.
- School administrators sometimes reference similar weather-scoring tools internally to support, not replace, their own decision-making process, since a consistent, data-based starting point can make the final call easier to communicate to families.
Even outside of winter storms, the same location-based approach helps with other weather-driven schedule changes. A rain delay before an outdoor event, for example, follows a similar decision pattern of checking timing, intensity, and local thresholds before making a call. Our Rain Delay Calculator uses that same idea for spring and fall scheduling.
If you are also dealing with extreme cold or summer heat scheduling changes, our Wind Chill Calculator and Heat Index Calculator use the same location-based approach to estimate cold-weather and heat-related closure risk.
Common Mistakes and Pro Tips
Even a good tool can give misleading results if it is used the wrong way. Here are the most common mistakes.
- Checking too early. A prediction made three days out is far less reliable than one made the night before or the morning of the storm.
- Ignoring ice in favor of snow totals. A quarter inch of ice can be more disruptive than four inches of snow.
- Assuming a national average applies to your district. Always check your specific ZIP code, not a general regional guess.
- Treating the percentage as a guarantee. A 90% score still leaves room for a district to stay open, and a 20% score does not rule out a surprise closure.
- Forgetting to check the official source. The calculator narrows the odds. Your district's own announcement is always the final word.
- Relying on a single data point. Snowfall alone, temperature alone, or wind alone rarely tells the full story. The combination of factors is what makes the prediction useful.
- Assuming last year's threshold still applies. Districts sometimes update their closure policy, road equipment, or bus routes between seasons, which can shift how much snow it actually takes to trigger a closure this year.
Pro tip: For the most reliable read, check your school closing calculator twice: once the evening before, and once again between 5 and 6 a.m., which is when most districts finalize their decision.
Read More : Snow Day Chance Calculator
Calculator vs. Weather App vs. Official Notice
People sometimes assume a weather app and a school closing calculator do the same job. They do not.
| Tool | What It Tells You | Best Used For |
|---|---|---|
| General weather app | Raw forecast: temperature, snowfall, wind | Understanding the storm itself |
| School closing calculator | A probability score based on weather plus district-specific closure patterns | Estimating your specific school's odds of closing |
| Official school notice | The final, confirmed decision | Confirming plans before you act on them |
The smartest approach uses all three together: a weather app to understand the storm, a school closing calculator to estimate your specific risk, and the official district notice to confirm before you make changes to your day.
Conclusion
A school closing calculator will not replace the call, text, or app notification from your school district, but it gives you a genuine head start. Instead of guessing based on a weather app alone, you get a location-specific probability built around the same factors superintendents actually weigh: snowfall, ice, temperature, timing, and your district's own history.