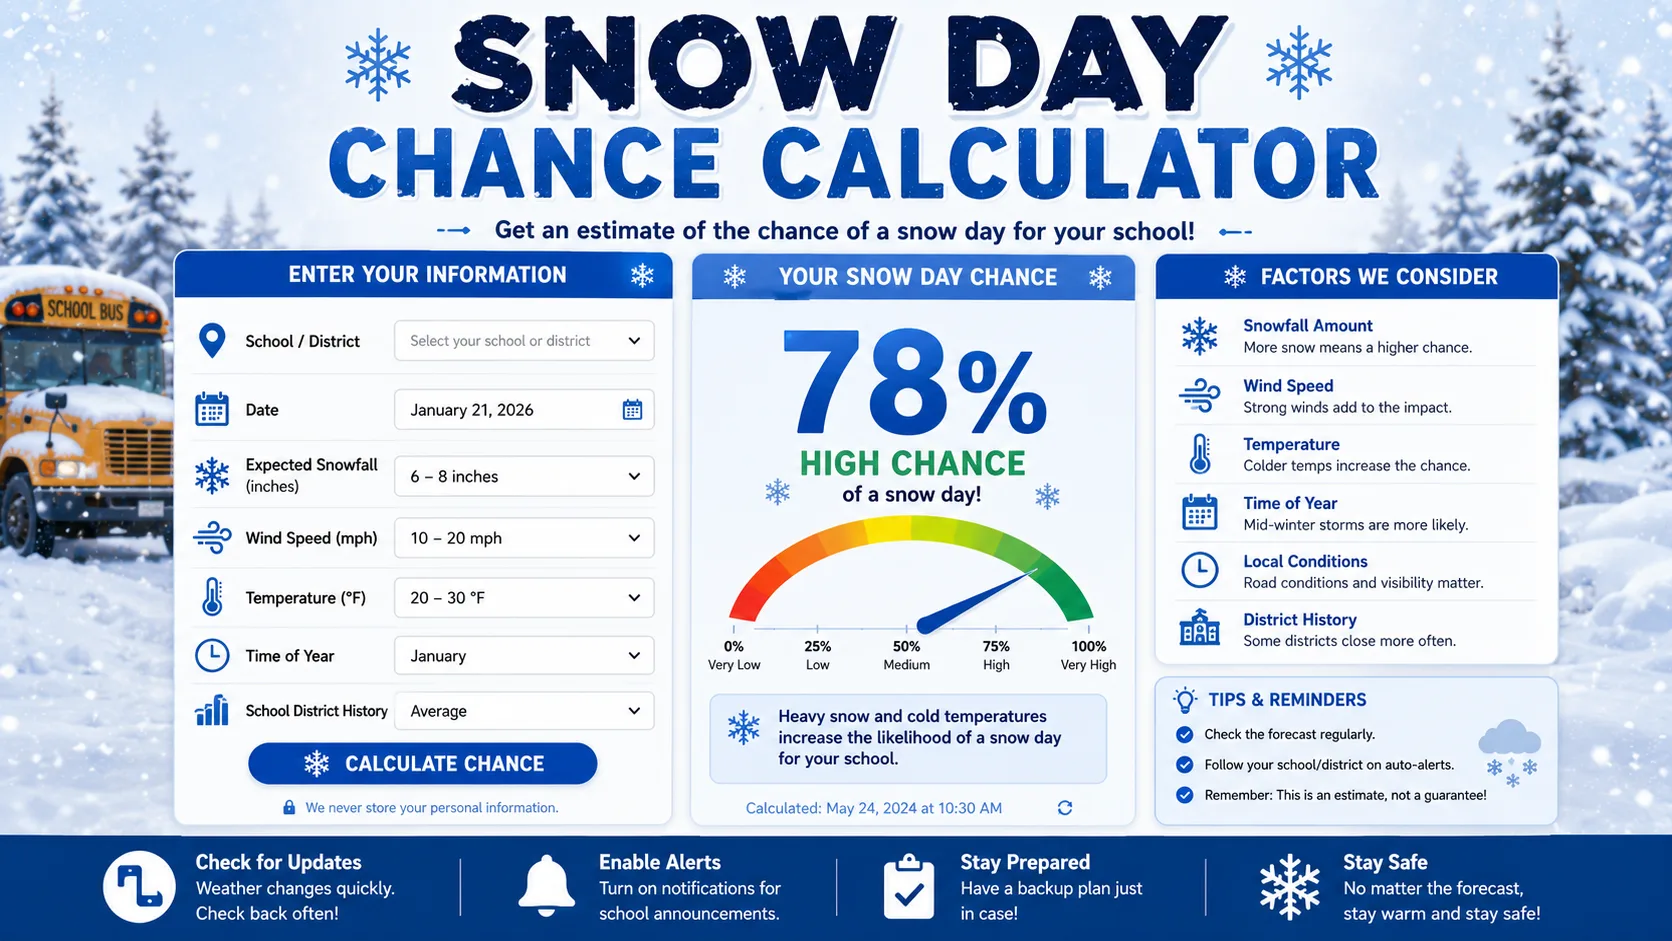
A snow day chance calculator turns a winter forecast into a single number: the percentage odds your school closes tomorrow. Instead of guessing from a weather app icon, you get a probability built from snowfall, wind chill, ice, and how your specific district has responded to storms in the past. This guide breaks down exactly how that percentage gets calculated, what changes it the most, and how to read a result like 65% correctly. You can check your own odds anytime with the snow day chance calculator.
What Is a Snow Day Chance Calculator
A snow day chance calculator estimates the odds, expressed as a percentage, that your school closes due to winter weather. Enter your ZIP code or city, and it compares tomorrow's forecast against the conditions that have historically triggered closures in your area.
The word "chance" matters here. Unlike a simple yes-or-no closure predictor, this type of calculator is built around probability. A 30% result and an 80% result both tell you something useful, even though neither is a guarantee.
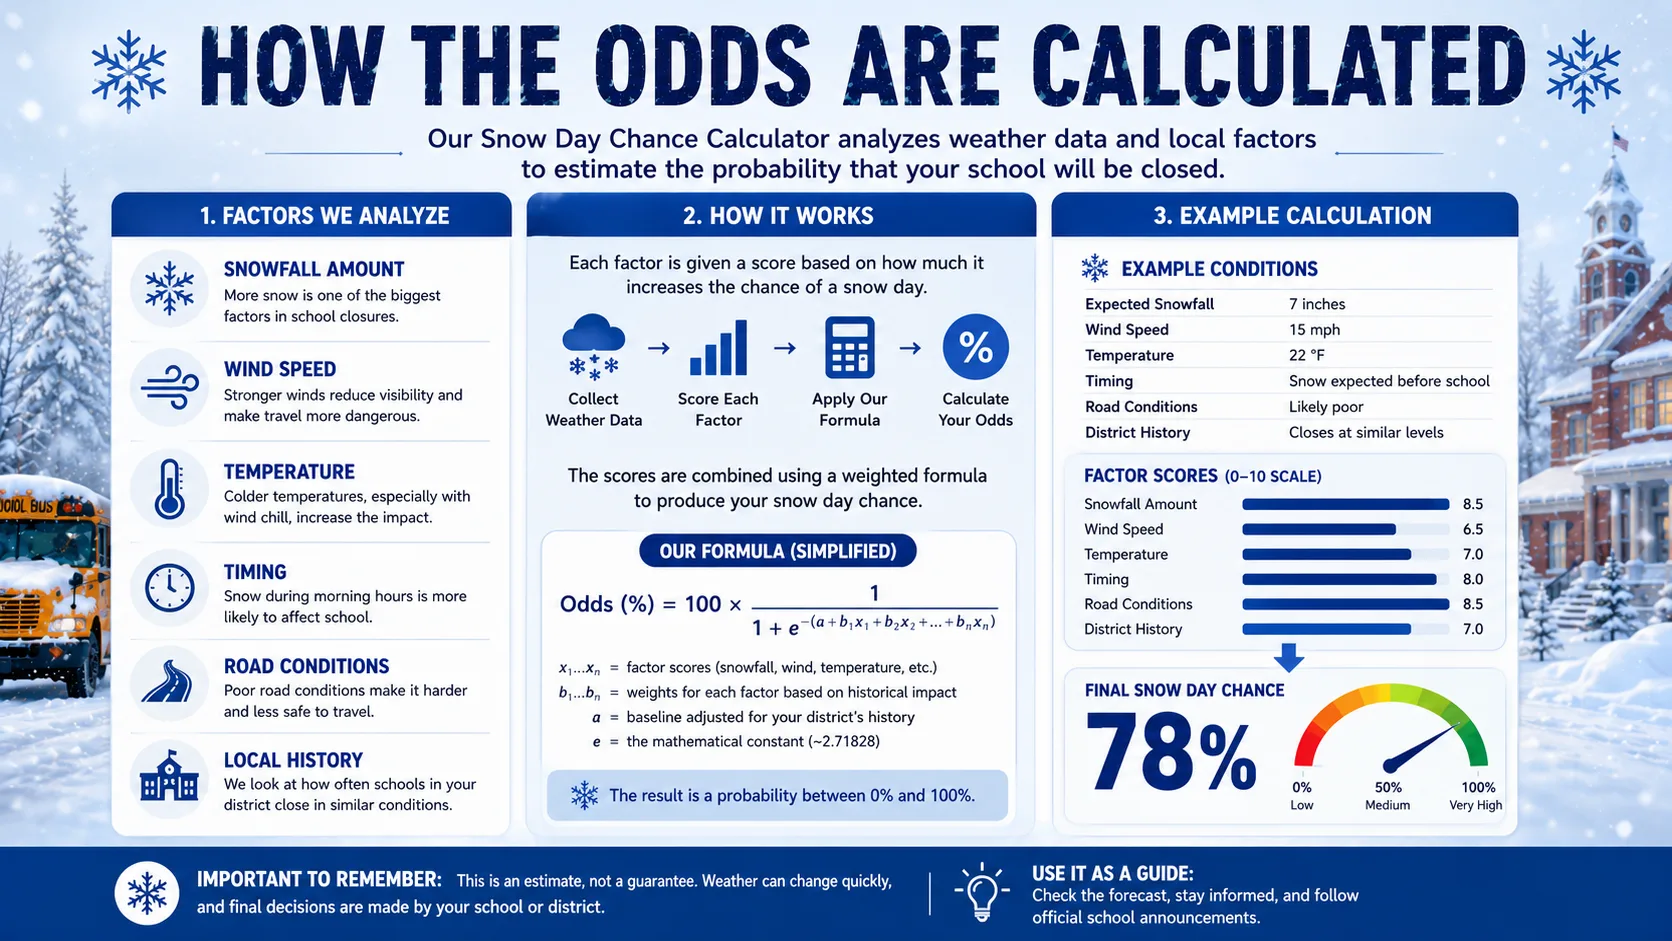
How the Odds Are Calculated
Behind every percentage is a scoring model that weighs several weather inputs against your district's known closure behavior. The calculator does not treat every location the same, since the same storm produces different odds in different places.
The process generally works like this:
- Pull the forecast: Snowfall total, temperature, wind speed, and precipitation type for the next 24 hours
- Apply regional weighting: The same 3 inches of snow scores differently in Vermont than it does in South Carolina
- Factor in timing: A storm peaking during the morning commute raises the odds more than one that clears out overnight
- Compare to historical patterns: Districts that have closed for similar conditions before are weighted toward a higher chance
- Output a single percentage: All the inputs collapse into one number you can act on quickly
Meteorologists generally caution that no forecast model is perfect this far in advance. Snow formation depends on a narrow band of atmospheric conditions, so a shift of just a degree or two can be the difference between snow, sleet, or rain. That uncertainty is part of why the calculator gives a chance rather than a promise.
What "Historical Closure Sensitivity" Actually Means
One of the more overlooked inputs in an accurate chance calculator is historical closure sensitivity, which is a fancy way of describing how twitchy a given district has been in past storms. A district that closed for a 2-inch snowfall three winters in a row is treated differently than one that has never closed for anything under 6 inches.
This matters because raw weather data alone can't capture policy differences between neighboring districts. Two towns twenty minutes apart can receive identical snowfall and make opposite decisions, simply because one district has a smaller bus fleet, more rural roads, or a superintendent who leans cautious. Folding historical behavior into the score helps the percentage reflect reality rather than just meteorology.
The tradeoff is that historical patterns can lag behind real change. A district that just added new plows or hired more bus drivers might close less often going forward, even though its historical data still reflects the old pattern. This is one reason odds should be treated as a strong estimate rather than an exact science.
Rural districts add another wrinkle. A single icy stretch of country road can be enough to close an entire district, even if the rest of the roads are perfectly clear, because a school bus can't safely reach every student without it. Urban and suburban districts, by contrast, usually make decisions based on aggregate conditions across many shorter routes rather than one problem stretch of road. This is part of why a rural district can post surprisingly high odds compared to a nearby city facing the exact same storm system.
What Changes Your Odds the Most
Not every factor moves the needle equally. Some tools let you manually adjust inputs to see which one swings your percentage the most, and the pattern is fairly consistent across regions.
| Factor | Typical Effect on Odds | Why It Matters |
|---|---|---|
| Snowfall total | High | The most visible factor, but not always the biggest driver of the final decision |
| Ice or freezing rain | Very high | Even a small amount makes roads unsafe faster than snow alone |
| Wind chill | Moderate to high | Extreme cold closes schools even without snow in some regions |
| Storm timing | Moderate | A storm during the morning commute raises odds more than an overnight one |
| District track record | Moderate | Districts that closed for similar storms before are more likely to again |
Key takeaway: Ice accumulation moves the odds faster than any other single factor. A district that shrugs off 4 inches of dry snow may still close for a tenth of an inch of ice, since ice makes both roads and sidewalks unsafe almost immediately.
Why Percentages Replaced Simple Yes-or-No Predictions
Early snow day tools gave a blunt yes-or-no guess, or a vague "likely" versus "unlikely" label. That approach broke down constantly, because winter storms rarely fall into two clean buckets. A storm that's 60% likely to trigger a closure isn't the same situation as one that's 95% likely, even though both might have been labeled "likely" under the old system.
Shifting to a percentage format solved that problem. It lets a calculator communicate genuine uncertainty instead of forcing a binary answer the weather itself doesn't support. A 55% chance tells you the situation is close to a toss-up, while a 92% chance tells you to plan for a closure with real confidence. That distinction is the entire value of a chance-based tool over a simple predictor.
How the Percentage Compares to a Meteorologist's Forecast
A weather forecast's "70% chance of snow" and a snow day calculator's "70% chance of closure" are answering different questions, even though they look similar. The forecast percentage describes the odds of precipitation occurring at all. The closure percentage describes the odds of a specific institutional decision, which depends on infrastructure, timing, and policy on top of the raw weather.
That's why a location can show a modest chance of snow but a high chance of closure, or the reverse. A light dusting with a 40% snow forecast can still produce an 85% closure chance in a district with almost no winter road treatment. Meanwhile, a snow-heavy forecast in a well-prepared northern district might only translate into a modest closure percentage, since the infrastructure absorbs conditions that would shut down a southern town entirely.
How to Check Your Odds
Getting your current snow day chance takes less than a minute.
- Open the calculator. Visit the snow day chance calculator from your phone or computer.
- Enter your ZIP code or city. Add a state or country code if your city name is shared by multiple locations.
- Read your percentage. The result shows your current odds along with a breakdown of the factors driving it.
- Check which factor is doing the most work. If the tool shows a factor breakdown, note whether snowfall, ice, or wind chill is pushing your odds up.
- Recheck between 6 and 10 p.m. the night before. This is typically when overnight forecasts firm up and the odds become more reliable.
- Check again early morning. A second look between 5 and 6 a.m. usually gives the most accurate read, right before most districts announce.
The full calculator directory has region-specific versions if you want to compare odds for more than one location, such as a second home or a relative's school district.
Real Odds by Region
The same weather event produces very different odds depending on regional infrastructure and closure history.
- Burlington, Vermont: 7 inches of snow with clear roads by mid-morning might land around 35 to 45 percent, since the district is well equipped for routine snowfall.
- Charleston, South Carolina: A dusting of snow, under 1 inch, can push odds above 90 percent, since the region has almost no snow-clearing infrastructure.
- Kansas City, Missouri: A half inch of ice with 2 inches of snow on top often scores in the 75 to 85 percent range, since ice is treated as the dominant risk factor.
- Seattle, Washington: Even 2 to 3 inches of snow can produce odds near 70 percent, since the hilly terrain and limited plow fleet make driving conditions disproportionately dangerous.
- Fargo, North Dakota: A wind chill of -30°F with minimal snowfall can still push odds past 60 percent, showing how extreme cold alone drives the number up.
For a broader regional breakdown, the state-by-state predictions page shows typical closure thresholds across the country.
What to Do at Each Odds Level
Knowing your percentage is only useful if you act on it correctly. Here's how to translate a given range into an actual plan for the next 12 to 24 hours.
Odds Above 75 Percent
- Line up backup childcare or confirm a remote work day in advance
- Prep activities or schoolwork your kids can do at home
- Check that emergency supplies, like flashlights and blankets, are accessible in case the storm also affects power
Odds Between 40 and 74 Percent
- Set an alarm to recheck between 5 and 6 a.m., when the odds are most reliable
- Prepare a flexible morning routine that works whether school runs on time, is delayed, or closes
- Keep your district's text or app alert notifications turned on
Odds Below 40 Percent
- Proceed with your normal plans, but build in a few extra minutes for the commute
- Do a final check early morning if the forecast has shifted significantly overnight
This tiered approach matters more than chasing a single perfect number. The goal of checking your odds isn't certainty, since true certainty doesn't exist until the district actually announces. The goal is giving yourself a realistic window to prepare for whichever outcome happens.
How to Read a Percentage Correctly
A common mistake is treating every percentage as a coin flip once it passes 50%. That is not how these odds work in practice.
- Under 30 percent: Closure is unlikely. Plan for a normal day, but keep an eye on any late-breaking forecast changes.
- 30 to 59 percent: Genuinely uncertain. A delay or early dismissal is about as likely as a normal day.
- 60 to 79 percent: Closure or a significant delay is more likely than not, though not guaranteed.
- 80 percent and above: Closure is highly likely, though local administrators still make the final call.
Odds also compress as the storm gets closer. A 55% chance four days out and a 55% chance the morning of the storm carry different weight, since the morning number is based on more complete data.
Read More : Snow Day Calculator 2026
Common Mistakes and Pro Tips
- Mistake: Treating a low percentage as zero risk. A 20% chance still means real potential for a delay, especially if the forecast shifts overnight.
- Mistake: Comparing your odds directly to a friend's in another state. A 70% in Seattle and a 70% in Vermont reflect very different weather situations.
- Mistake: Only checking once. Odds shift as new data comes in, sometimes significantly within a few hours.
- Pro tip: If a factor breakdown is available, pay closer attention to ice and wind chill than to snowfall alone, since those two often move the needle faster.
- Pro tip: Treat anything within 10 points of 50% as a toss-up and prepare for both outcomes rather than betting on one.
- Mistake: Ignoring storm timing. Two storms with identical snowfall totals can produce very different odds if one hits during the morning commute and the other clears out overnight.
- Pro tip: If your district recently added infrastructure, like new plows or salt trucks, its actual closure behavior may run a bit lower than the historical pattern suggests, so treat borderline percentages with that in mind.
Tracking Your Odds Through a Storm's Lifecycle
Your percentage isn't a single static number. It moves through a fairly predictable arc as a storm approaches, and understanding that arc helps you know when to trust it.
- 4 to 5 days out: Odds are rough and can swing widely between checks as forecast models disagree with each other.
- 2 to 3 days out: Models start converging, and odds usually stabilize into a clearer range, though still with meaningful uncertainty.
- The evening before: This is typically the most useful early checkpoint, since the overnight forecast has mostly resolved.
- Early morning of: Odds here are the most reliable, since they incorporate observed conditions rather than a forecast alone.
If you only check once, the early morning window gives you the most dependable number. But checking at each stage helps you see whether a storm is trending toward a closure earlier, which is useful if you need extra lead time for childcare or travel plans.
Watching the trend line matters more than fixating on any single reading. Odds that climb steadily from 30% to 50% to 70% across three checks tell a very different story than odds that jump straight to 70% and hold steady. A rising trend usually means the forecast is solidifying toward a bigger event, while a steady number suggests more confidence in the outcome either way.
Snow Day Chance Calculator vs. Other Winter Weather Tools
A chance calculator focuses specifically on closure probability, but it pairs well with other condition-specific tools when the forecast involves more than one hazard.
| Tool | Best For | Key Output |
|---|---|---|
| Snow Day Chance Calculator | Estimating closure probability from snow, ice, and cold | A single percentage odds figure |
| Wind Chill Calculator | Checking how dangerous the cold actually feels | Wind chill temperature and frostbite risk time |
| Heat Index Calculator | Warm-weather safety planning outside winter | Feels-like temperature |
| Rain Delay Calculator | Estimating delays for outdoor events and sports | Delay probability |
The site's blog has deeper explainers if you want to understand how each tool builds its score behind the scenes.
Conclusion
A snow day chance calculator gives you something a plain forecast can't: a single, location-specific number that reflects how likely your particular school is to close. Understanding what drives that percentage, especially ice, wind chill, and storm timing, helps you read a result like 65% correctly instead of guessing. It won't replace your district's official announcement, but it gives you a real head start on planning, whether that means arranging childcare a day early or simply setting a later alarm with confidence. Check your odds above to see your current snow day chance.