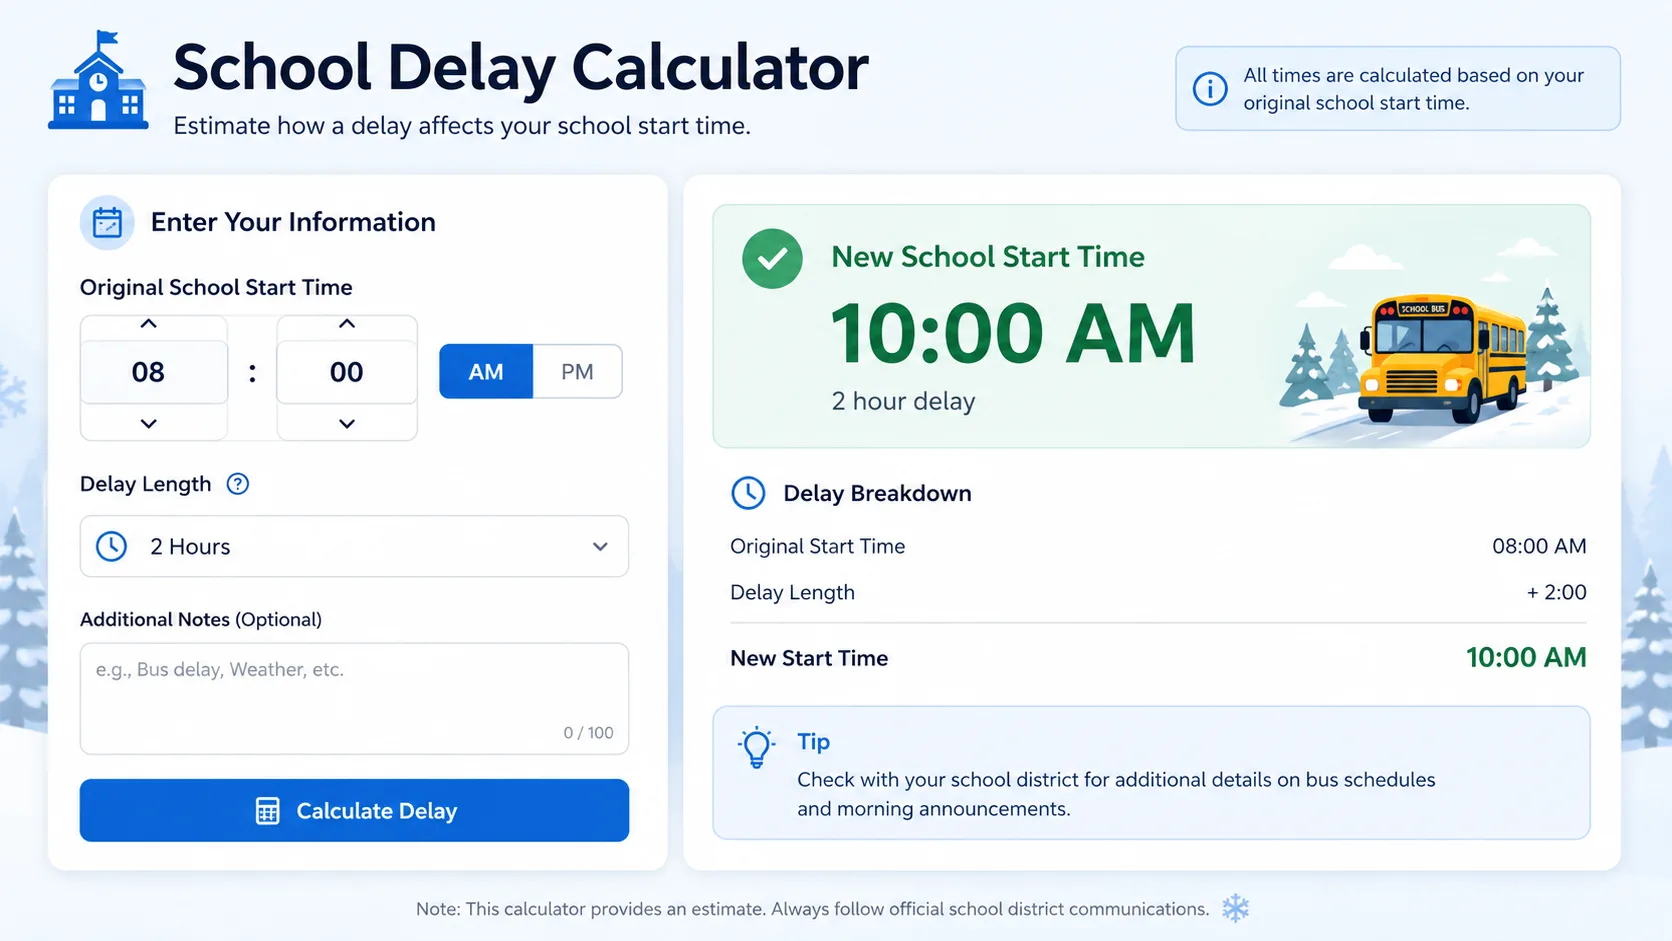
Every winter, the same question spreads across group chats and family kitchens the night before a storm: will there be a delay tomorrow? A school delay calculator takes the guesswork out of that question by turning weather data, school district history, and local policy patterns into a clear probability score.
In this guide, you will learn exactly how a school delay calculator works, the formula behind the prediction, how to use one step by step, and how to read your results like someone who actually understands district decision-making, not just someone refreshing a weather app.
What Is a School Delay Calculator?
A school delay calculator is a tool that estimates the likelihood of a school delay or closure based on local weather conditions, temperature, snowfall, ice, wind chill, and historical decisions made by your specific school district.
Unlike a general weather forecast, a delay calculator is built specifically around one question: will the superintendent call a delay, a closure, or nothing at all?
Most tools express this as a percentage probability, for example a 70 percent chance of a two-hour delay, rather than a simple yes or no answer, because district decisions depend on more than just snowfall totals.
How Does a School Delay Calculator Work?
Behind every prediction is a scoring system that weighs several inputs together. Here is what typically goes into the calculation.
Key Factors Used in the Formula
- Snowfall amount, usually measured in inches expected overnight or before morning buses run
- Ice accumulation, which often weighs more heavily than snow because of road danger
- Temperature and wind chill, since extreme cold alone can trigger a delay even without snow
- Timing of the storm, particularly whether snowfall peaks during the early morning commute window
- District history, meaning how that specific school system has responded to similar conditions in the past
- Road and district size, since large rural districts with long bus routes delay more often than small urban ones
The Basic Probability Formula
Most school delay calculators use a weighted scoring model that looks roughly like this:
Delay Score = (Snowfall Weight × Inches) + (Ice Weight × Ice Level) + (Wind Chill Weight × Cold Severity) + (District History Adjustment)
Each weight is assigned based on how much that factor historically influences a delay decision in a given region. For example, a district in the northern Midwest may weight snowfall lower than a district in the southern United States, where even one inch of snow can shut roads down because of limited snow removal equipment.
Search Intent: What People Actually Want
People searching for a school delay calculator generally fall into two groups, and a good tool needs to serve both:
- Tool-first users who want to enter their zip code or district and get an immediate probability
- Explanation-seekers who want to understand why delays happen so they can judge the odds themselves next time
The strongest resources combine both: a working calculator plus a clear explanation of the reasoning behind the number.
Step by Step: How to Use a School Delay Calculator
- Enter your school district or zip code so the tool can pull district-specific history
- Input current or forecasted weather conditions, including expected snowfall, ice, and overnight low temperature
- Select the timing window, since a storm hitting at 4 a.m. behaves very differently than one hitting at 7 a.m.
- Review your probability score, usually shown as a percentage or a simple likely, possible, unlikely label
- Recheck within 12 hours of your commute, since probability shifts as new forecast data comes in

Real-Life Examples with Calculations
Example 1: Heavy Snow, Rural District
A rural district with long bus routes is forecasted to receive 6 inches of snow overnight, with temperatures around 20°F and no ice. Given this district's history of delaying at just 3 inches, the calculator returns a 92 percent chance of a two-hour delay, with a smaller chance of a full closure if snowfall continues into the morning.
Example 2: Light Snow, Urban District
An urban district with strong snow removal resources is forecasted to receive 1.5 inches of snow, with temperatures near freezing. Because this district historically only delays at 4 inches or more, the calculator returns a 15 percent chance of delay, mostly driven by icy patches rather than the snow itself.
Example 3: Ice Storm, Any District
Even with only half an inch of ice forecasted, most calculators push probability above 85 percent regardless of district size, since ice is treated as a higher-risk factor than snow across almost every scoring model due to black ice and downed power line risks.
Snow Day Probability by Condition
Here is a simplified breakdown of how different weather conditions typically influence delay probability:
| Condition | Typical Delay Probability | Most Likely Outcome |
|---|---|---|
| Under 1 inch snow, no ice | 5 to 15% | No delay |
| 1 to 3 inches snow | 25 to 45% | Possible delay |
| 3 to 6 inches snow | 60 to 85% | Likely delay or closure |
| Any measurable ice | 80 to 95% | Delay or closure likely |
| Wind chill below -20°F | 70 to 90% | Cold-related delay likely |
| 6+ inches snow overnight | 90%+ | Full closure likely |
Visualizing the Probability Curve
Delay Probability (%)
100 |                                 ■■■■
 90 |                            ■■■■ ■■■■
 80 |                       ■■■■ ■■■■ ■■■■
 70 |                       ■■■■ ■■■■ ■■■■
 60 |                  ■■■■ ■■■■ ■■■■ ■■■■
 50 |                  ■■■■ ■■■■ ■■■■ ■■■■
 40 |             ■■■■ ■■■■ ■■■■ ■■■■ ■■■■
 30 |             ■■■■ ■■■■ ■■■■ ■■■■ ■■■■
 20 |        ■■■■ ■■■■ ■■■■ ■■■■ ■■■■ ■■■■
 10 |   ■■■■ ■■■■ ■■■■ ■■■■ ■■■■ ■■■■ ■■■■
  0 |______________________________________
      0"   1"   2"   3"   4"   5"   6"+
              Snowfall Amount
This curve reflects a common pattern across most districts: probability rises slowly at low snowfall, then climbs sharply once accumulation crosses the 2 to 3 inch threshold, which is typically where road conditions become genuinely hazardous for bus travel.
Benefits and Use Cases
- Parents can plan childcare the night before instead of waiting for a 5 a.m. phone alert
- Teachers can decide whether to prep a lesson plan or a substitute plan
- Students can gauge whether it is worth starting that homework tonight
- Bus drivers and staff can better anticipate scheduling changes
- District administrators can cross-check their own internal weather assessments against public probability tools
Read More : Snowfall Forecast This Week
Common Mistakes People Make
- Relying only on snowfall totals and ignoring ice, wind chill, and timing
- Using a generic national calculator instead of one calibrated to their specific district's history
- Checking only once, the night before, instead of rechecking closer to the morning commute
- Assuming a high snowfall number always means a closure, when timing and road treatment matter just as much
- Ignoring past patterns, since districts with a history of over-cautious closures tend to repeat that behavior
According to the National Weather Service, road conditions and timing relative to morning commute hours are frequently more influential in school closure decisions than total snowfall alone, which explains why two districts can receive identical snow totals and make completely different calls.
A common observation among school transportation directors is that decisions are rarely made on snowfall in isolation. Ice, temperature at bus pickup time, and whether plows have had time to treat main routes typically carry more weight than the forecast headline number.
Pro Tips for Getting the Most Accurate Prediction
- Always input district-specific history if the calculator allows it, rather than using a generic zip code average
- Recheck predictions within the 12 hour window before your commute, since overnight model updates matter
- Pay attention to ice warnings even when snowfall looks minor, since ice consistently produces higher delay probability than snow alone
- Cross-reference with local news alerts, since some districts announce decisions based on internal road assessments not captured by public weather data
Conclusion
A school delay calculator turns an anxious guessing game into an informed probability estimate by combining snowfall, ice, temperature, timing, and district history into one score. The key is understanding that no single number tells the whole story. Snowfall matters, but ice, timing, and your specific district's track record often matter just as much.
Use the calculator as your starting point the night before a storm, then recheck it as the morning commute approaches for the most accurate read on whether tomorrow brings a delay, a closure, or a completely normal school day.
Also Checkout :