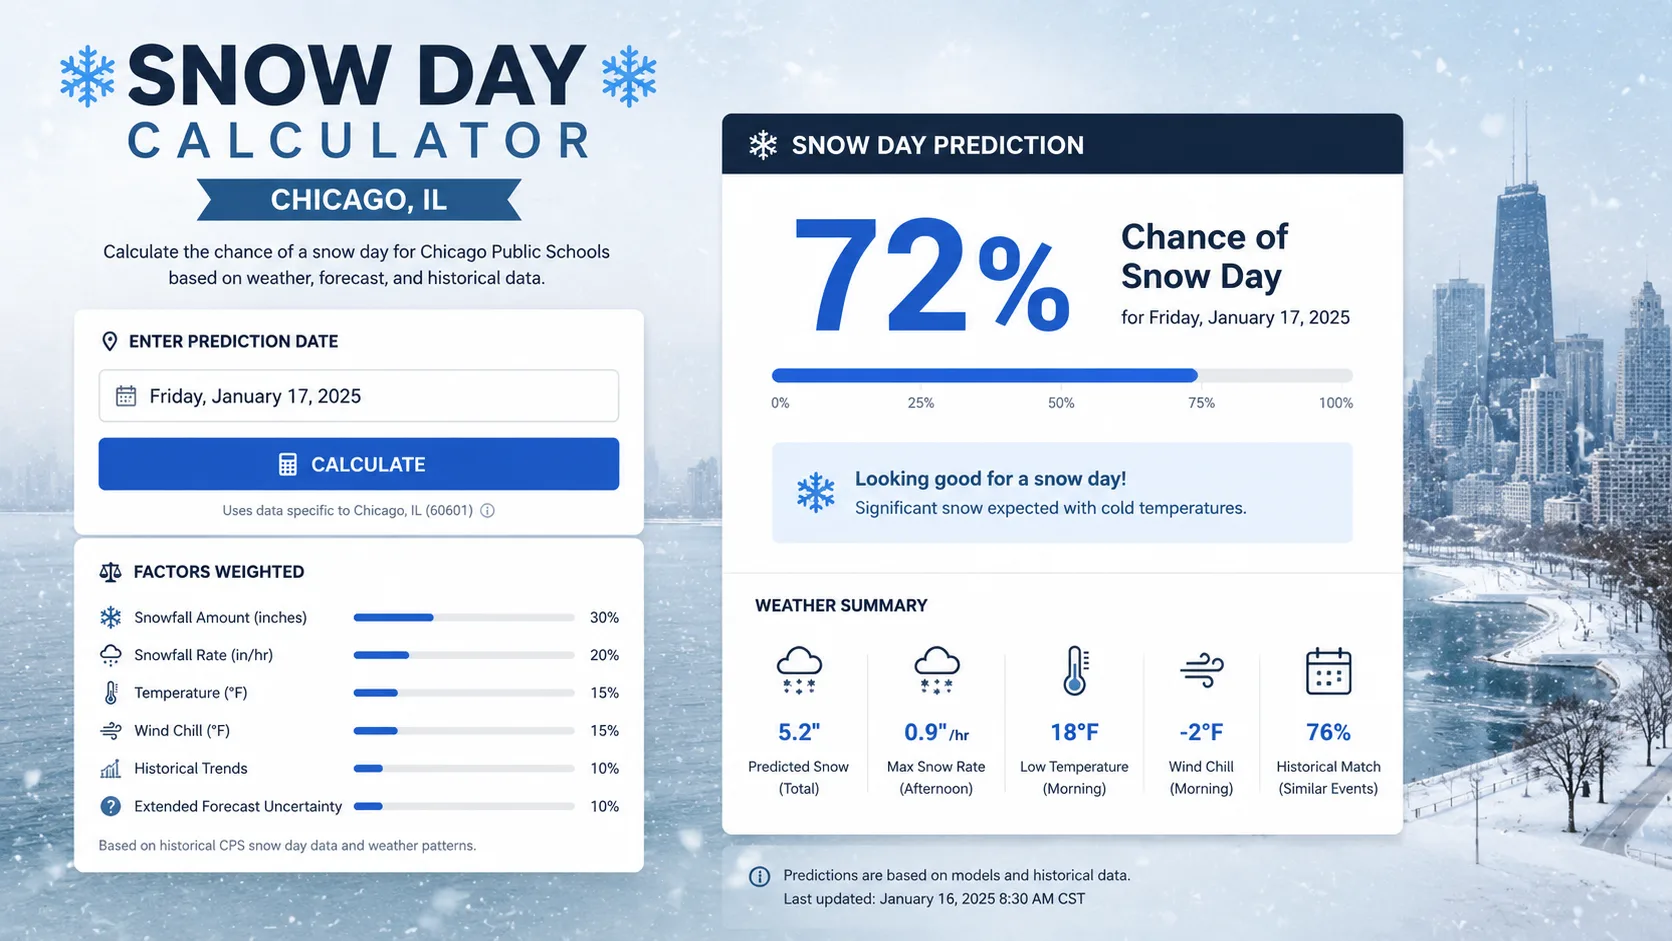
Everything you need to predict a Chicago school closure before the official call goes out.
If you've typed "snow day calculator Chicago IL" into Google the night before a storm, you already know the feeling: refreshing the weather app, checking the district website, and still not knowing whether your kids need backpacks tomorrow. A good snow day calculator turns that guesswork into a number, a percentage chance that Chicago area schools close, delay, or dismiss early because of snow, ice, or dangerous cold.
This guide breaks down exactly how a Chicago snow day calculator works, the real formula behind the prediction, how Chicago Public Schools actually makes its closure decisions, and real examples with numbers so you can estimate your own odds even without a tool open in front of you.
📌 Key Takeaway
Chicago Public Schools rarely closes for snow alone. The district has only closed for snow a handful of times in the last 30 years, most notably during the historic February 2011 blizzard. Suburban and downstate Illinois districts close far more often, and extreme cold or wind chill has triggered more Chicago-area closures historically than snowfall by itself.
What Is a Snow Day Calculator for Chicago IL?
A snow day calculator is a prediction tool that estimates the probability of a school closure, delay, or early dismissal based on forecast weather data for a specific ZIP code or school district. Instead of reading a raw weather forecast and guessing what it means for schools, the calculator translates snowfall totals, ice risk, wind chill, and timing into a single closure percentage.
For Chicago specifically, the calculator needs to account for something most generic tools miss: Chicago has a much higher snow tolerance than most U.S. cities. A snowfall total that shuts down schools in Georgia or Texas is a routine Tuesday in Cook County. That is why a calculator built around national averages will overestimate Chicago closures, while one tuned to local thresholds gives a far more realistic number.
Who Actually Uses a Snow Day Calculator?
- Parents planning childcare or work schedules the night before a storm
- Students hoping for an extra day off (let's be honest)
- Teachers and staff deciding whether to prep for a normal school day
- Bus companies and district transportation coordinators assessing road risk
- Local news producers covering winter weather segments
How Does the Chicago Snow Day Calculator Work?
Most snow day calculators, including the Chicago-focused versions currently ranking on Google, pull live forecast data and weigh five to seven core variables. Here is what actually moves the needle for a Chicago IL prediction.
1. Expected Snowfall Accumulation
The single biggest input is how much snow is forecast to fall, and just as importantly, when. A storm that drops six inches overnight and stops by 5 a.m. is far less disruptive than one still dumping snow during the morning commute.
2. Ice and Freezing Rain Risk
Ice is often more dangerous than snow. A thin glaze on untreated side streets can shut down bus routes even when total precipitation looks minor on paper.
3. Wind Chill and Extreme Cold
This is the factor most people underestimate. Chicago has canceled school for dangerously low wind chills even on clear, dry days with zero snow on the ground.
4. Storm Timing Relative to the Morning Commute
A storm arriving at 3 a.m. gives plow crews a head start. A storm still active at 6:30 a.m., right as buses are loading, dramatically raises closure odds.
5. Road Condition and Snow Removal Capacity
Chicago's plow fleet and salt infrastructure are built for frequent snow, which is why the city can absorb totals that would paralyze other regions. Calculators need to weight this local capacity, not a national baseline.
6. District-Specific Closure History
CPS, suburban districts like those in DuPage or Lake County, and downstate Illinois districts all have different closure thresholds based on past decisions and bus route geography.
The Snow Day Calculator Formula Explained
There is no single universal formula, but most tools approximate closure probability using a weighted model similar to this:
Each factor is scored on a 0 to 100 scale based on forecast severity, then combined into a final percentage. A result above roughly 70% generally signals a likely closure, 40 to 70% suggests a possible delay or early dismissal, and below 40% usually means school stays open with normal or slightly adjusted schedules.
Illinois Snowfall vs. Closure Probability
Chicago's snow tolerance is much higher than the national average, which is exactly why generic calculators overestimate local closures. The table below shows roughly how snowfall totals translate to closure likelihood for a typical Chicago-area district, based on historical closure patterns.
| Forecast Snowfall | Typical Chicago Impact | Estimated Closure Chance |
|---|---|---|
| Under 2 inches | Routine plowing, minimal delays | Under 5% |
| 2 to 4 inches | Slower commute, rarely a closure trigger alone | 5% to 15% |
| 4 to 6 inches | Possible delay in suburban districts | 15% to 35% |
| 6 to 10 inches | Delays common, closures possible if timed with commute | 35% to 65% |
| 10+ inches or blizzard conditions | Widespread closures likely, especially outside CPS | 65% to 95% |
Note: Chicago Public Schools has a notably higher threshold than surrounding suburbs. The chart above reflects a blended average across the wider Chicago metro area, not CPS specifically.
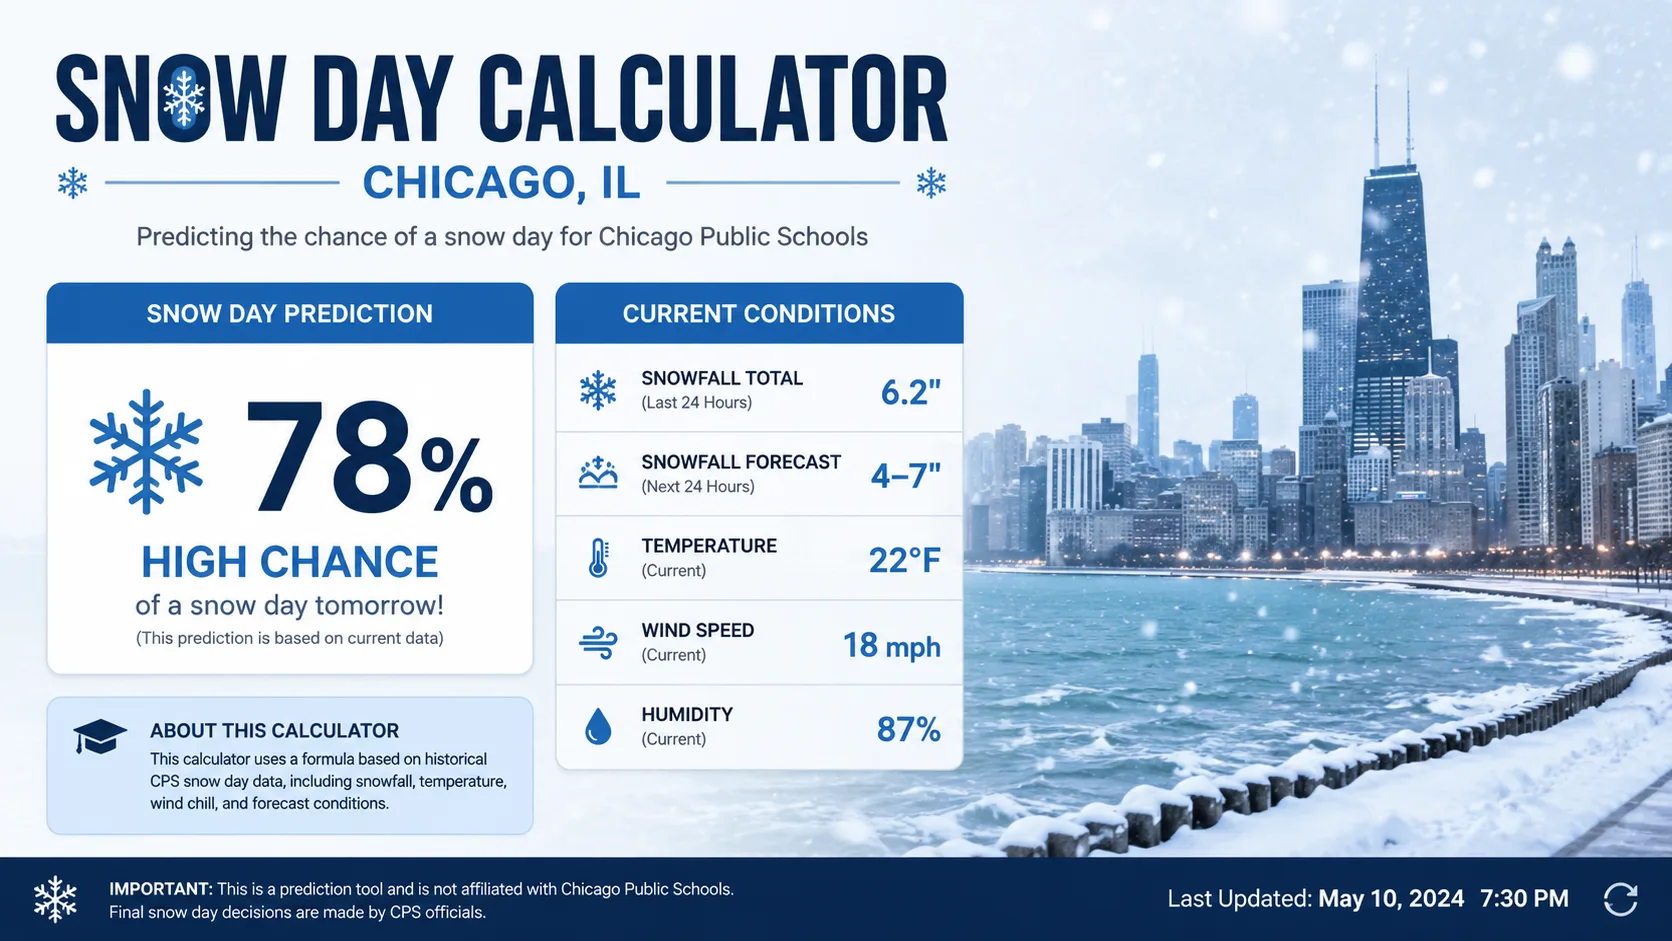
How to Use a Snow Day Calculator for Chicago Schools: Step by Step
- Enter your ZIP code or district. Chicago metro closure odds vary block by block once you leave the city, so precise location matters more than "Chicago" as a whole.
- Select your school type. Public, private, and parochial schools often make independent decisions, even within the same neighborhood.
- Check the forecast window. Look specifically at the overnight-to-morning window, not the full-day snowfall total.
- Review the closure percentage and factor breakdown. A high wind chill score with a low snowfall score still points toward a cold-related closure.
- Check back the evening before. Predictions firm up dramatically in the 12 to 18 hours before a potential closure, since districts themselves usually decide by 5 or 6 a.m.
- Confirm with your district's official channel. Calculators are a planning tool, not a replacement for the district's actual announcement.
Chicago-Specific Closure Factors You Won't Find in National Calculators
Chicago Public Schools vs. Suburban Districts
CPS is one of the largest school districts in the country, and its size actually makes it slower to close. Chicago Public Schools has stated that its goal is to keep schools open whenever possible, since many students rely on school meals and in-person learning, and the district coordinates closure decisions with the city's Office of Emergency Management and Communication rather than making the call in isolation. Suburban districts, by contrast, often have smaller transportation networks and can pivot to a closure or e-learning day more quickly.
Lake-Effect Snow and Regional Variation
Northern Illinois and areas near the Wisconsin border see higher snow totals and more drifting than the city itself, largely due to lake-effect bands off Lake Michigan. That means a suburb 40 minutes north can have a completely different closure outlook than downtown Chicago on the same morning.
The 38-Inch Baseline
Illinois receives roughly 38 inches of snow in a typical year, which is part of why Chicago-area infrastructure, plow fleets, and driver habits are built to absorb far more snow than cities in the South or on the West Coast before anyone considers a closure.
Historical Chicago Snow Day Closures: What the Data Shows
Looking at past closures helps explain why the calculator weights things the way it does.
- February 2011 Groundhog Day Blizzard: Roughly 20 inches of snow fell on Chicago, and CPS closed for two consecutive days. At the time, it was the first CPS snow closure since 1999, showing just how rare a full closure actually is for the district.
- January 1994 and January 1997: Chicago-area schools closed not for snow, but for extreme cold, with wind chills reported as low as 40 to 50 degrees below zero in the 1997 event.
- January 1988: Many suburban schools closed for wind chills near 38 below zero, while Chicago Public Schools stayed open that particular year due to an unrelated scheduling issue.
Wind Chill: The Factor That Closes Chicago Schools More Than Snow
Wind chill closures are arguably more predictable than snow closures because they follow clearer temperature thresholds. Many Chicago-area districts begin considering closures once wind chills approach 25 to 30 degrees below zero, since frostbite can occur on exposed skin in well under 15 minutes at those levels.
| Wind Chill Range | Typical District Response |
|---|---|
| 0°F to -15°F | School stays open, shortened outdoor recess |
| -15°F to -25°F | Indoor recess, possible bus delays |
| -25°F to -35°F | Delay or closure likely in suburban districts |
| Below -35°F | Widespread closures across the Chicago metro area |
Real-Life Examples: How the Calculator Plays Out
Example 1: The Overnight Clipper
Forecast: 3 inches of snow arriving between midnight and 4 a.m., temperatures around 20°F, no ice.
Calculation: Snowfall Score 25 × 0.30 = 7.5, Ice Risk 5 × 0.25 = 1.25, Wind Chill 15 × 0.20 = 3, Commute Timing 10 × 0.15 = 1.5, District History 20 × 0.10 = 2. Total: roughly 15%.
Result: School opens on time, possibly with a slightly slower bus schedule.
Example 2: The Morning Ice Event
Forecast: Half an inch of freezing rain transitioning to snow, arriving right at 6 a.m.
Calculation: Snowfall Score 20 × 0.30 = 6, Ice Risk 80 × 0.25 = 20, Wind Chill 20 × 0.20 = 4, Commute Timing 75 × 0.15 = 11.25, District History 30 × 0.10 = 3. Total: roughly 44%.
Result: Two-hour delay likely in suburban districts; CPS more likely to open on time or delay only slightly.
Example 3: The Polar Vortex Morning
Forecast: No new snow, but overnight lows of minus 15°F with wind chills near minus 38°F.
Calculation: Snowfall Score 0 × 0.30 = 0, Ice Risk 10 × 0.25 = 2.5, Wind Chill 95 × 0.20 = 19, Commute Timing 40 × 0.15 = 6, District History 60 × 0.10 = 6. Total: roughly 33.5%, but wind chill severity alone often overrides the blended score for cold events.
Result: High likelihood of closure or e-learning day across most Chicago-area suburbs, consistent with the extreme cold closures of 1988, 1994, and 1997.
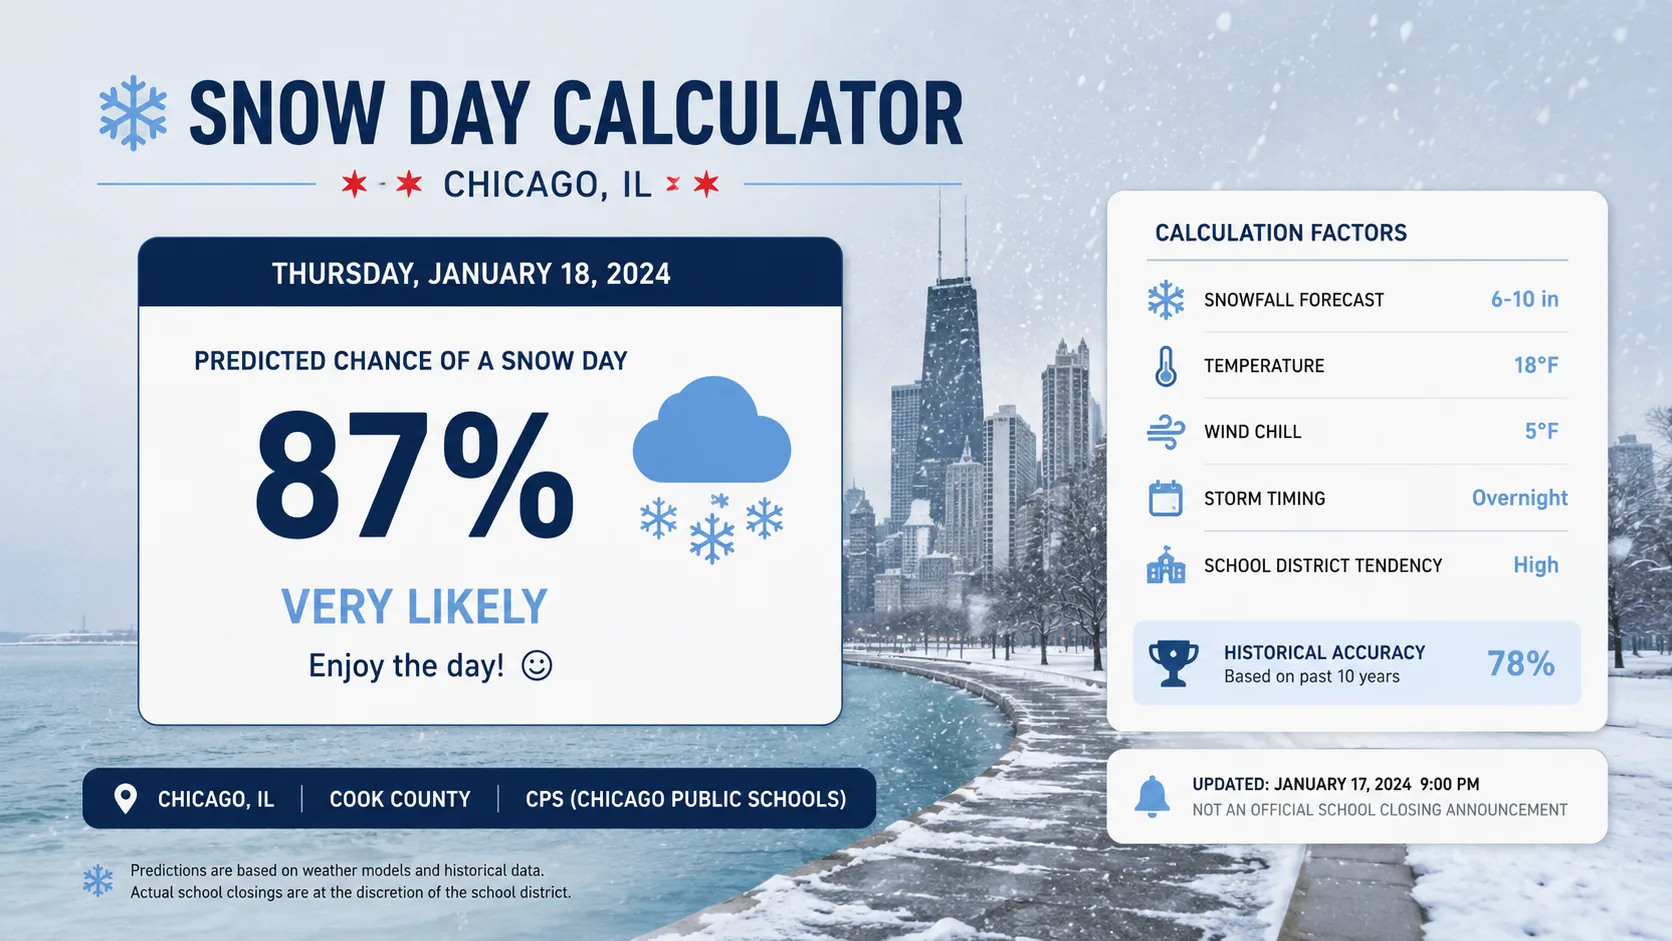
Benefits of Using a Snow Day Calculator
- Plan childcare earlier instead of waiting for a 5 a.m. robocall
- Reduce morning stress by knowing your realistic odds the night before
- Compare districts if you have kids attending different schools
- Understand the "why" behind a closure instead of just the outcome
- Track storms in real time as forecasts update through the evening
Common Mistakes People Make With Snow Day Predictions
- Using a national average calculator instead of one tuned to Chicago's higher snow tolerance
- Focusing only on total snowfall and ignoring wind chill, which has historically closed more Chicago schools
- Checking too early before the forecast has stabilized; predictions made two or three days out change significantly
- Assuming CPS and suburban districts will make the same call on the same morning
- Ignoring storm timing and only looking at the daily snowfall total, not when it falls
Pro Tips for Reading Chicago Snow Day Odds
- Check the calculator the evening before, then again first thing in the morning, since most Chicago-area districts announce decisions between 5 and 6 a.m.
- Watch for a wind chill warning issued by the National Weather Service Chicago office; these are one of the strongest closure predictors in the region.
- Follow your specific district's social media or automated call system, since calculators estimate probability, not certainty.
- If CPS is showing a low closure percentage but your suburban district is showing high odds, trust the local number, not the citywide average.
2026 Winter Outlook for Chicago: What to Expect
Illinois' winter climate has remained broadly consistent with its historical averages, with Chicago typically seeing snowfall spread across November through March and the heaviest single-day totals concentrated in January and February. According to long-term NOAA climate data for O'Hare International Airport, Chicago sees an inch or more of snow on about 11 days per year on average, while storms dropping five inches or more in a single day happen only once or twice per season, and true 10-inch-plus blizzards remain roughly a once-a-decade event. That rarity is exactly why calculator tools matter: most winter days fall into a gray zone where snow is present but a closure is genuinely uncertain.
Conclusion
A reliable snow day calculator for Chicago IL does more than guess at snowfall totals. It weighs ice risk, wind chill, storm timing, and each district's own closure history to give you a realistic probability instead of a coin flip. Chicago's high snow tolerance means the city closes far less often than people expect, while extreme cold has historically been just as likely, if not more likely, to shut schools down.
The next time a storm is in the forecast, check your ZIP code the evening before, revisit the odds first thing in the morning, and always confirm with your district's official channel before finalizing plans. Understanding the "why" behind the percentage is what separates a genuinely useful tool from a random guess.
Also Checkout :