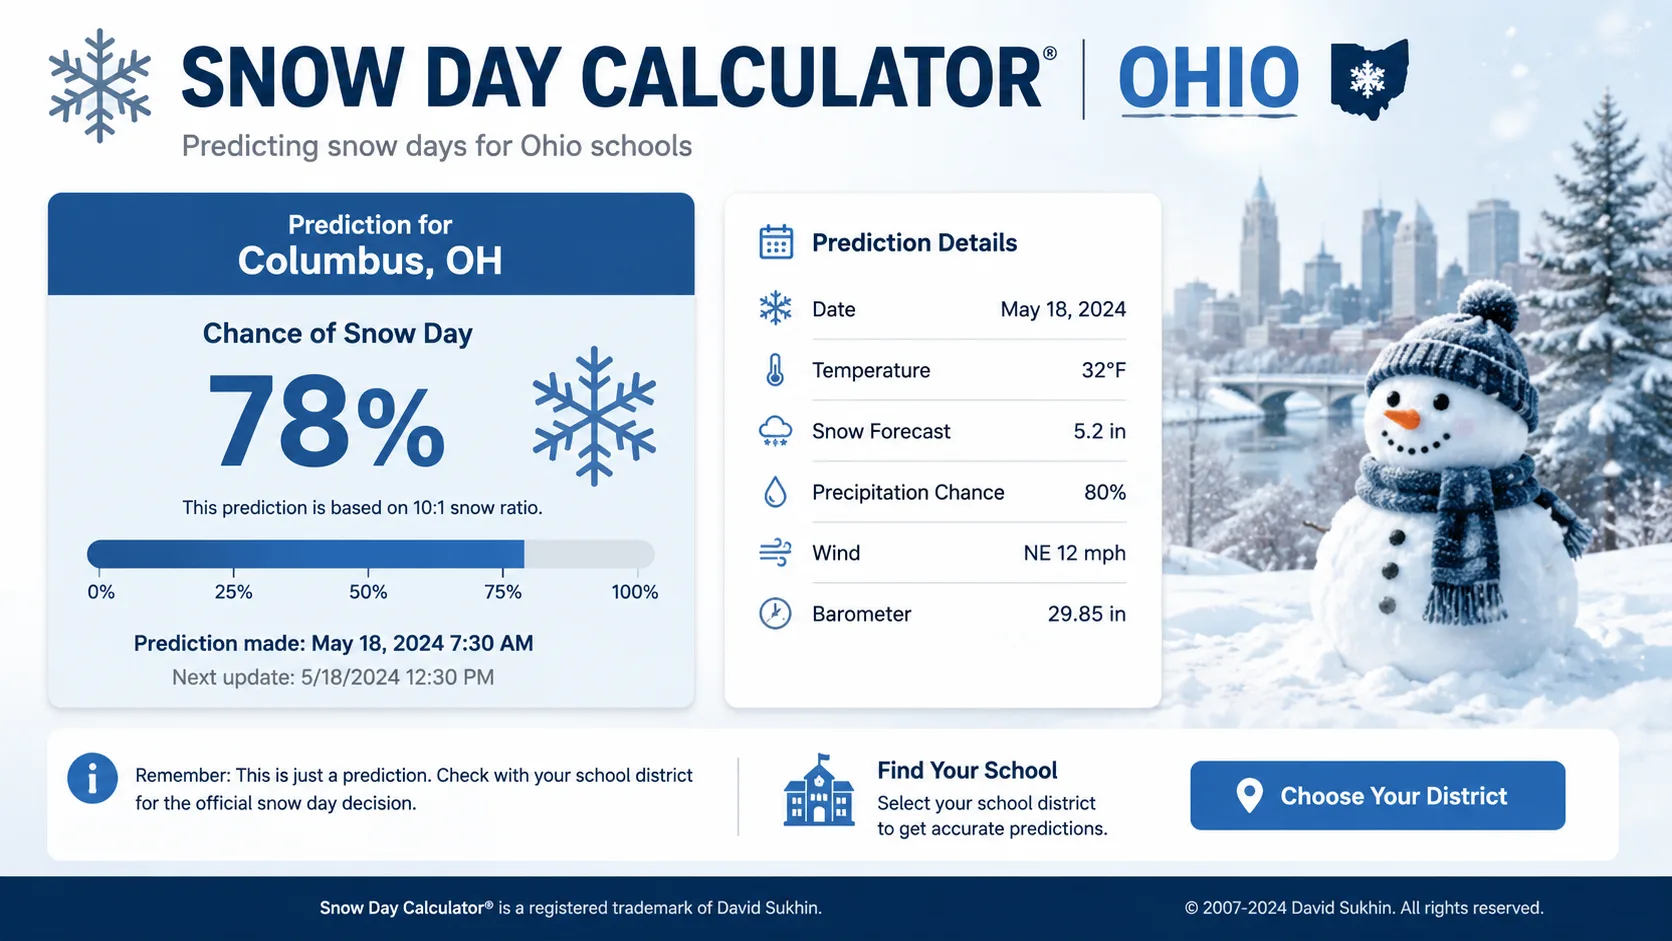
If you've searched "snow day calculator Ohio" the night before a storm, you know the drill: checking radar, scrolling district Facebook pages, and still not knowing whether tomorrow is a normal school day. A good snow day calculator turns that uncertainty into a percentage, an estimate of how likely Ohio schools are to close, delay, or dismiss early because of snow, ice, or dangerous cold.
This guide walks through exactly how a snow day calculator for Ohio works, the formula behind the prediction, how Ohio's unique snow emergency system factors into school closures, and real worked examples so you can estimate your own odds even without a tool open.
📌 Key Takeaway
Ohio schools don't close based on snowfall totals alone. Closure decisions are heavily tied to the county's snow emergency level, and most Ohio districts close once their county reaches Level 2, with almost all districts closing at Level 3. Northeast Ohio's Lake Erie Snowbelt sees far more frequent closures than Columbus or Cincinnati because of intense, fast-moving lake-effect snow bands.
What Is a Snow Day Calculator for Ohio?
A snow day calculator is a prediction tool that estimates the probability of a school closure, delay, or early dismissal based on forecast weather data for a specific ZIP code or school district. Rather than staring at a raw weather forecast and guessing what it means for your kids, the calculator converts snowfall totals, ice risk, wind chill, and storm timing into one closure percentage.
Ohio is a uniquely tricky state to predict for, because closure decisions are shaped by county-level snow emergency declarations, not just by school district policy. A calculator that ignores Ohio's Level 1 through Level 3 snow emergency system is missing one of the biggest local drivers of a closure, which is exactly the gap this guide fills.
Who Actually Uses an Ohio Snow Day Calculator?
- Parents across Cleveland, Columbus, Cincinnati, and Toledo planning childcare the night before
- Students hoping for a day off (no judgment)
- Teachers and staff deciding whether to prep lesson plans for the next morning
- Bus drivers and transportation coordinators assessing rural and township road risk
- Commuters using the same weather signals to plan drive times
How Does the Ohio Snow Day Calculator Work?
Most snow day calculators, including the Ohio-specific tools currently ranking on Google, weigh five to seven core variables. Here's what actually drives an Ohio prediction.
1. Expected Snowfall Accumulation
The most obvious input is how much snow is forecast, and critically, when it falls. A storm that dumps six inches overnight and clears by 5 a.m. is far less disruptive than one still active during bus pickup.
2. Ice Accumulation and Freezing Rain
Ice is frequently the bigger threat in Ohio, especially in central and southern parts of the state where freezing rain is more common than heavy snow. A thin ice glaze on untreated township roads can shut down bus routes even with minimal total precipitation.
3. Wind Chill and Extreme Cold
Bitter wind chills, particularly in a polar vortex event, can close Ohio schools even on days with clear skies and no new snow, since students waiting at rural bus stops face real frostbite risk.
4. Storm Timing Relative to the Commute
A storm arriving at 2 a.m. gives plow crews a head start before buses roll. One still dropping snow at 6:30 a.m. sharply raises closure odds.
5. County Snow Emergency Level
This is the factor most generic calculators completely miss. Ohio county sheriffs, not school districts, declare snow emergency levels, and district closure decisions are frequently tied directly to that county-level declaration.
6. District-Specific Closure History
Northeast Ohio Snowbelt districts near Lake Erie have a much higher tolerance for routine lake-effect snow than districts in southern Ohio, which close more readily for the same totals because their infrastructure sees less snow overall.
Ohio's Snow Emergency Levels, Explained
Understanding Ohio's snow emergency system is the single most useful thing you can do before checking a calculator, because it directly predicts what your school district is likely to do.
| Level | Road Conditions | Typical School Response |
|---|---|---|
| Level 1 | Roads hazardous with blowing and drifting snow, possible ice; drive with caution | Schools usually remain open, possible delay |
| Level 2 | Roads hazardous and very icy; only necessary travel recommended | Most schools close or switch to a delay |
| Level 3 | Roads closed to all non-emergency personnel | Virtually all schools close |
Since Ohio's 88 counties each have their own sheriff making this call, the same storm can trigger a Level 2 in one county and only a Level 1 next door. That's why a calculator tuned to your specific county, not just "Ohio" broadly, gives a far more useful answer.
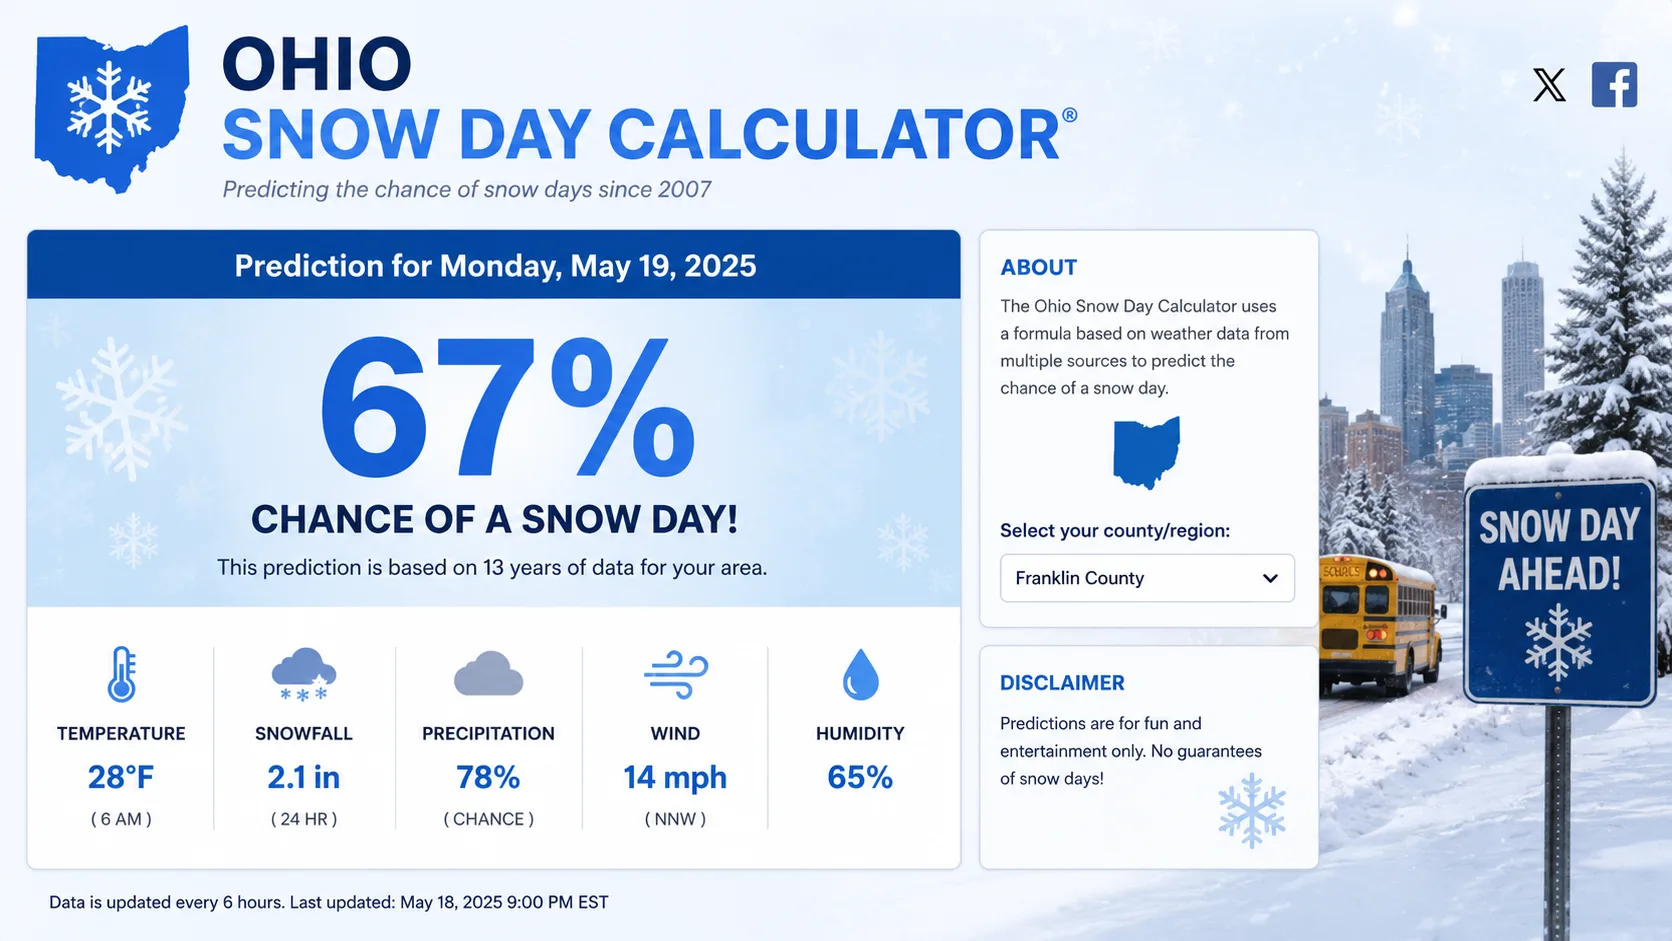
The Snow Day Calculator Formula Explained
There is no single universal formula, but most tools approximate closure probability using a weighted model similar to this:
Each factor is scored from 0 to 100 based on forecast severity, then combined into a final percentage. A result above roughly 70% generally signals a likely closure, 40 to 70% suggests a possible delay, and below 40% usually means school stays open with normal or slightly adjusted schedules.
Ohio Snowfall vs. Closure Probability
Ohio's snow tolerance varies dramatically by region. The table below shows a blended estimate across a typical Ohio district, factoring in both snowfall and the likely county emergency level.
| Forecast Snowfall | Likely County Level | Estimated Closure Chance |
|---|---|---|
| Under 2 inches | No declaration or Level 1 | Under 10% |
| 2 to 4 inches | Level 1 possible | 10% to 25% |
| 4 to 6 inches | Level 1 to Level 2 | 25% to 50% |
| 6 to 10 inches | Level 2 likely | 50% to 80% |
| 10+ inches or lake-effect squalls | Level 2 to Level 3 | 80% to 98% |
How to Use a Snow Day Calculator for Ohio Schools: Step by Step
- Enter your ZIP code or county. Closure odds in Ohio depend heavily on which sheriff's jurisdiction you fall under, so county-level accuracy matters more than a statewide estimate.
- Select your school district. Public, private, and parochial schools in the same county can make independent decisions.
- Check the overnight-to-morning forecast window, not just the full-day snowfall total.
- Watch for a snow emergency level announcement from your county sheriff's office, which often confirms or overrides the calculator's raw percentage.
- Review the closure percentage and factor breakdown. A high ice score with a moderate snowfall score still points strongly toward a closure.
- Check back after 6 p.m. the evening before, when forecast models are most reliable and most districts have started internal discussions.
- Confirm with your district's official channel before finalizing plans, since calculators estimate probability, not certainty.
Ohio-Specific Closure Factors You Won't Find in National Calculators
The Lake Erie Snowbelt vs. the Rest of Ohio
Ohio's Snowbelt region along Lake Erie is known for intense, highly localized lake-effect snow squalls that can drop several inches in an hour while a town twenty miles away sees nothing at all. Districts in Cleveland, Ashtabula, and Lake County plan around this volatility constantly, while Columbus and Cincinnati deal far more often with freezing rain and ice storms than heavy snow.
Ohio's Statewide Snowfall Baseline
Ohio averages roughly 28 inches of snow per year statewide, though that figure hides enormous regional variation. Some Snowbelt communities near Lake Erie can see well over double the state average, while parts of southern Ohio see closer to half of it.
County Sheriffs, Not School Boards, Often Set the Tone
Because Ohio Revised Code gives county sheriffs the authority to declare snow emergencies, many superintendents treat a Level 2 or Level 3 declaration as a strong signal, if not an outright trigger, for closing schools, even when the district's own transportation team could technically still run buses.
Read More : Snow Day Calculator Chicago IL
Real-Life Examples: How the Calculator Plays Out in Ohio
Example 1: The Central Ohio Ice Event
Forecast: Half an inch of freezing rain overnight in Franklin County, temperatures hovering right at freezing, no county emergency declared yet.
Calculation: Snowfall Score 15 × 0.25 = 3.75, Ice Risk 85 × 0.25 = 21.25, Wind Chill 20 × 0.15 = 3, Commute Timing 70 × 0.15 = 10.5, County Emergency Score 40 × 0.20 = 8. Total: roughly 46.5%.
Result: Two-hour delay likely, with a real chance of escalation to a closure if the county moves to Level 2 overnight.
Example 2: The Snowbelt Lake-Effect Squall
Forecast: 8 to 12 inches of lake-effect snow in Lake County, heavy band expected to sit over the area through the morning commute.
Calculation: Snowfall Score 85 × 0.25 = 21.25, Ice Risk 30 × 0.25 = 7.5, Wind Chill 40 × 0.15 = 6, Commute Timing 90 × 0.15 = 13.5, County Emergency Score 80 × 0.20 = 16. Total: roughly 64.25%.
Result: Closure likely, especially if the county sheriff declares a Level 2 before 10 p.m.
Example 3: The Statewide Cold Snap
Forecast: No new snow, but wind chills near minus 25°F across most of Ohio due to a polar vortex.
Calculation: Snowfall Score 0 × 0.25 = 0, Ice Risk 10 × 0.25 = 2.5, Wind Chill 90 × 0.15 = 13.5, Commute Timing 35 × 0.15 = 5.25, County Emergency Score 15 × 0.20 = 3. Total: roughly 24.25%, but many districts override the blended score entirely for extreme cold safety thresholds.
Result: Closure or two-hour delay still likely in many districts, since bus stop exposure time is treated as a standalone safety trigger independent of the formula.
Benefits of Using a Snow Day Calculator
- Plan childcare earlier instead of waiting on a 5:30 a.m. automated call
- Reduce morning stress by knowing your realistic odds the night before
- Compare counties if your family crosses school district or county lines for work and school
- Understand the "why" behind a closure, especially the snow emergency level connection
- Track fast-moving lake-effect bands in real time if you're in the Snowbelt
Common Mistakes People Make With Ohio Snow Day Predictions
- Ignoring the county snow emergency level, which is one of the strongest closure signals in Ohio specifically
- Assuming all of Ohio has the same snow tolerance, when Snowbelt and non-Snowbelt districts behave very differently
- Focusing only on total snowfall and overlooking ice, which is often the bigger threat in central and southern Ohio
- Checking too early before forecasts stabilize, since lake-effect bands can shift dramatically overnight
- Forgetting that private and parochial schools often decide independently of public districts in the same county
Pro Tips for Reading Ohio Snow Day Odds
- Check the calculator after 6 p.m. the evening before, since that's when weather models firm up and most Ohio districts begin internal discussions.
- Watch your county sheriff's office page or Nixle alerts for the official snow emergency level, which frequently confirms what the calculator is already predicting.
- If you live near a county line, check both counties, since sheriffs make independent declarations and your commute may cross jurisdictions.
- In the Snowbelt, monitor lake-effect band movement specifically, since totals can change drastically within a few miles.
2026 Winter Outlook for Ohio: What to Expect
Ohio's winter climate has remained broadly consistent with its historical pattern, with the heaviest snow concentrated in the Lake Erie Snowbelt from November through March and central and southern Ohio dealing more with mixed ice events. Ohio averages close to 28 inches of snowfall statewide each year, but Snowbelt communities regularly exceed that figure while much of the rest of the state falls below it. That regional split is exactly why a one-size-fits-all national calculator underperforms in Ohio, and why factoring in your specific county's snow emergency history matters as much as the raw forecast.
Conclusion
A reliable snow day calculator for Ohio does more than track snowfall totals. It weighs ice risk, wind chill, storm timing, and critically, the county snow emergency level that shapes so many Ohio closure decisions. Because Ohio splits so clearly between the Snowbelt and the rest of the state, a calculator that treats every county the same will always fall short of one built around local patterns.
The next time a storm is in the forecast, check your ZIP code after 6 p.m. the evening before, watch for your county sheriff's snow emergency declaration, and always confirm with your district's official channel before finalizing plans. Understanding the system behind the percentage is what turns a guess into a genuinely useful prediction.
Also Checkout :