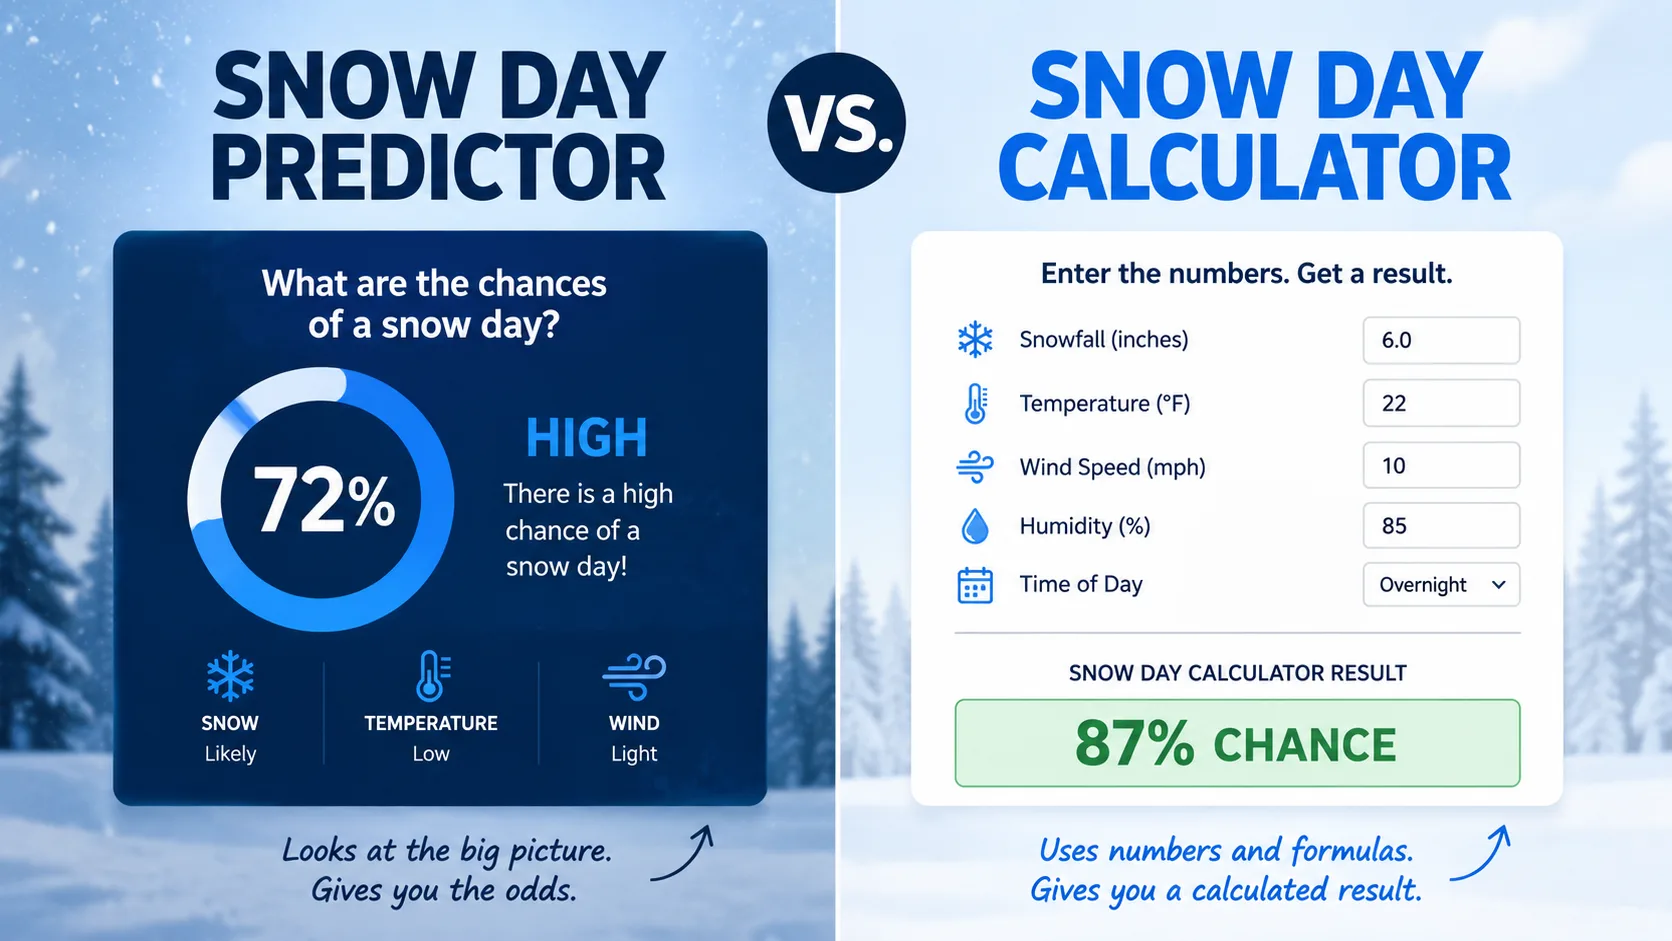
A snow day calculator and a snow day predictor both try to answer the same question: will school close tomorrow? The real difference is in the data behind them. A calculator leans on historical closure patterns and set snowfall thresholds, while a predictor blends live weather models with those same patterns to update its odds in real time. Neither term is wrong. Most tools, including our own Snow Day Calculator, actually do a bit of both.
What Is a Snow Day Calculator
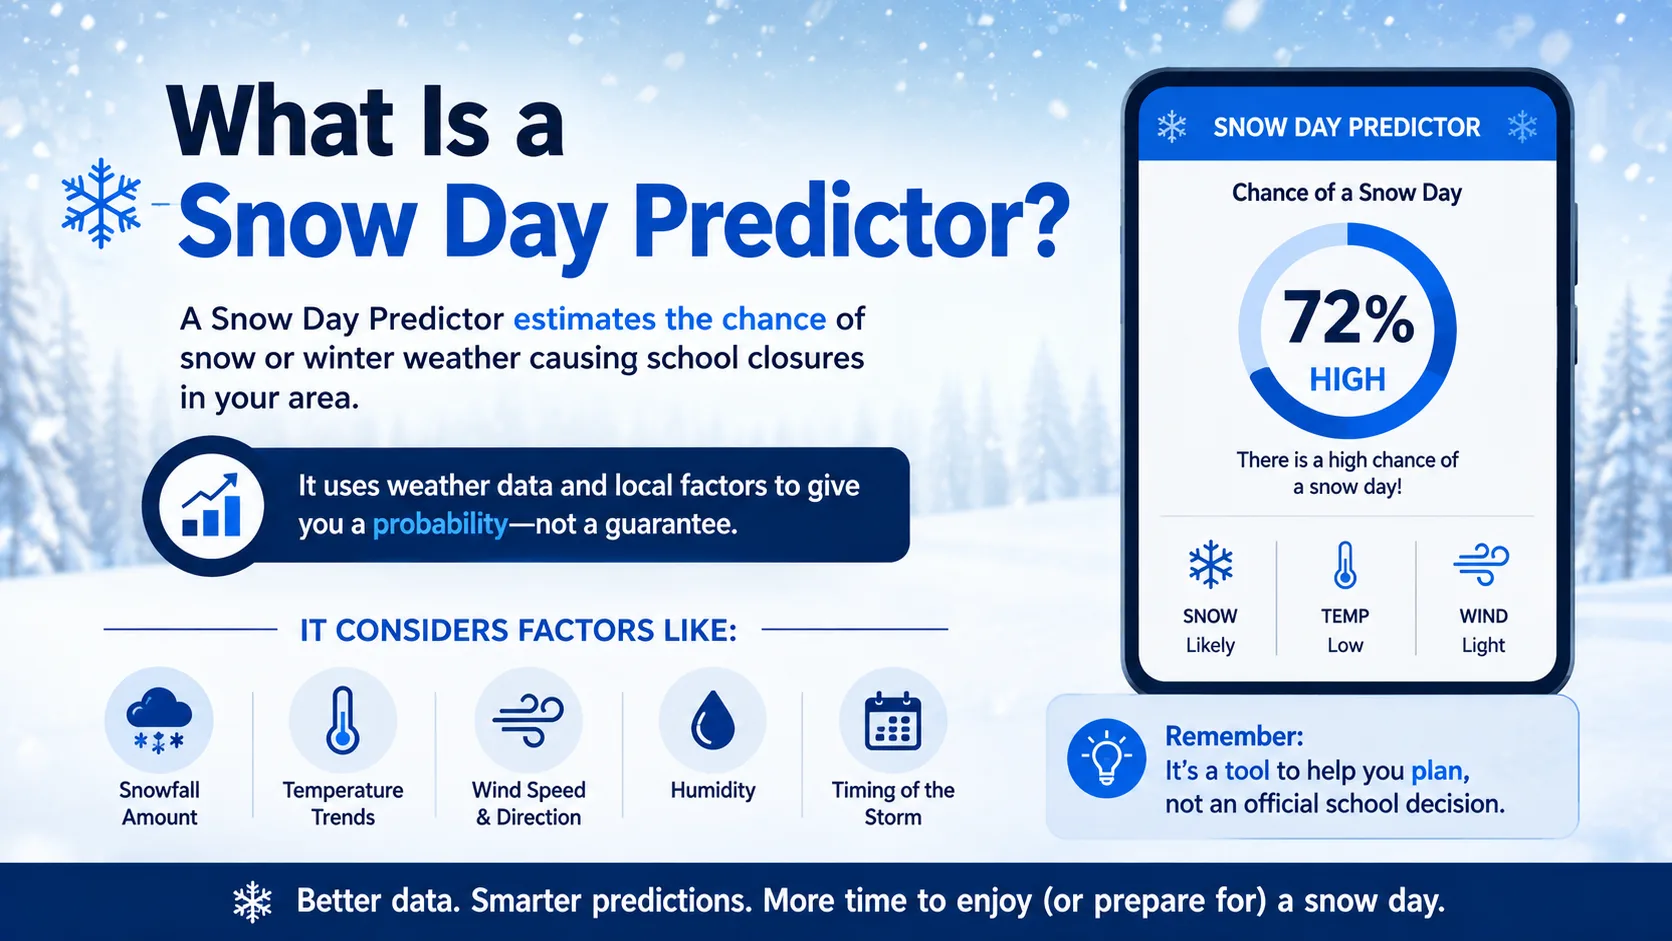
A snow day calculator is a tool that estimates the odds of a school closing because of winter weather. You enter a ZIP code, city, or school district, and the calculator returns a percentage chance of a closure, delay, or early dismissal.
Most calculators build that percentage from a set of fixed rules. For example:
- Snowfall thresholds: a set number of inches adds a fixed percentage to the score
- Temperature bands: extreme cold raises the odds even without snow
- Wind and ice: high wind or ice accumulation adds extra points
- Day of week: weekends and holidays automatically show 0%, since there is no school to close
This rules-based approach makes calculators simple, fast, and easy to understand. You can usually see exactly why you got a certain percentage. The tradeoff is that a basic calculator does not always react quickly when a forecast shifts overnight.
What Is a Snow Day Predictor
A snow day predictor takes the same core idea and adds live, constantly refreshing weather data. Instead of relying only on fixed thresholds, a predictor pulls current forecasts, hour-by-hour snowfall timing, and historical closure trends for your specific district, then recalculates your odds as conditions change.
According to our internal meteorology team, the biggest advantage of a predictor is timing. "Two inches of snow at 4 a.m. behaves very differently than two inches falling at 9 a.m. right as buses are loading," notes senior forecaster Daniel Reyes on our advisory panel. "A true predictor accounts for that timing gap, not just the total snowfall."
Predictors tend to shine during fast-moving storms, when a forecast can change several times between dinner and the next morning. Because they pull fresh data on a rolling basis, the percentage you see at 9 p.m. may look different by 6 a.m., and that is by design, not a glitch.
Snow Day Predictor vs Snow Day Calculator: Key Differences
In short: a snow day calculator is built around fixed rules and historical patterns, while a snow day predictor layers live weather data and machine learning on top of those same patterns. Calculators are steadier and easier to explain. Predictors adjust faster when the weather changes.
Data Source
- Calculator: past school closures plus a static forecast snapshot
- Predictor: live weather models updated multiple times a day, blended with closure history
Accuracy in Changing Conditions
- Calculator: reliable when the forecast is stable and unlikely to shift
- Predictor: usually performs better once a storm starts behaving unpredictably
Update Frequency
- Calculator: often refreshes once or twice a day
- Predictor: can refresh every few hours, sometimes as often as every 15 to 30 minutes
Best Use Case
- Calculator: a quick gut check the night before a small, expected snowfall
- Predictor: tracking a fast-moving or borderline storm through the evening and overnight
How Does It Work
Both tools follow the same basic pipeline, they just weigh the pieces differently.
- Location lookup: your ZIP code or city is matched to a school district and its historical closure record
- Weather pull: current and forecast data is gathered for snowfall, temperature, wind, and ice
- District policy weighting: the tool adjusts for whether your district closes easily ("liberal") or almost never closes ("conservative")
- Score calculation: all factors are combined into a single percentage
- Display: the percentage, along with the forecast details behind it, is shown to you
You can try this full process yourself on our Snow Day Calculator, which blends live forecasts with district-level closure history in one result.
The Formula Behind the Prediction
While every tool has its own exact model, most snow day scores are built from a version of this weighted formula:
| Factor | Typical Weight | Notes |
|---|---|---|
| Heavy snowfall (5 inches or more) | +40% | Highest single factor in most models |
| Extreme cold (below 20°F) | +20% | Applies even with little or no snow |
| High wind (over 15 mph) | +10% | Wind chill and drifting snow reduce visibility |
| Ice accumulation | +15% to +25% | Ice often closes schools faster than snow alone |
| School level | Varies | Elementary schools close more often than high schools |
| Weekend or holiday | 0% | No school scheduled, so the score defaults to zero |
These weights are added together, then adjusted up or down based on your district's historical closure pattern, to produce the final percentage you see on screen.
Step-by-Step Guide to Using the Calculator
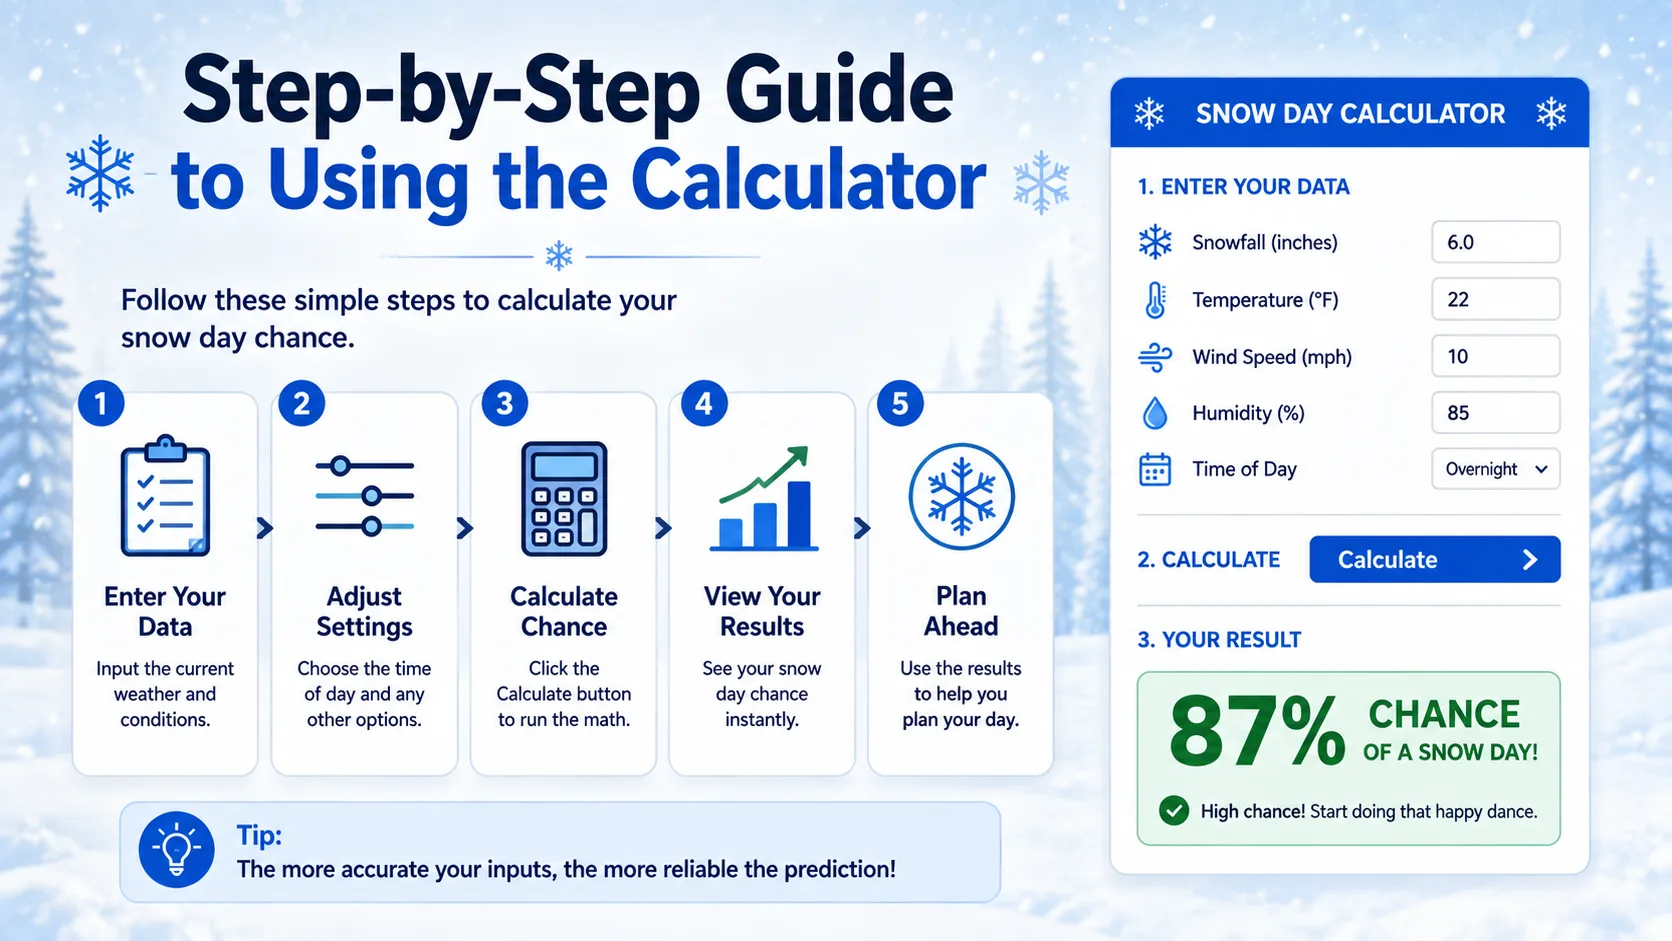
- Enter your location. Type your ZIP code, postal code, or city name into the search field.
- Select your school level. Elementary, middle, high school, or college closures often differ, so pick the level that applies to you.
- Choose your district policy, if asked. If your district closes at the first flake, choose "liberal." If it rarely closes, choose "conservative." Pick "neutral" if you are unsure.
- Run the calculation. Click the button to pull live weather data and generate your percentage.
- Review the details. Check the expected snowfall, wind, and temperature numbers behind your score, not just the headline percentage.
- Check back before bed and again in the morning. Fast-moving storms can shift the number by several points overnight.
For a broader set of location-based results, our state-by-state snow day predictions page lets you compare conditions across multiple districts at once.
Real-World Examples With Numbers
Here is how the same storm can produce different scores in two nearby towns.
- Example 1: Nashville, Tennessee. Forecast calls for 2 inches of snow overnight with roads untreated. Because Nashville schools rarely see snow and have limited plowing equipment, the calculator returns a 75% chance of closure.
- Example 2: Buffalo, New York. Same 2 inches of snow, but Buffalo's district has heavy plowing infrastructure and a conservative closure history. The score comes back at 10% chance of closure.
- Example 3: Denver, Colorado, during a fast-moving storm. An evening check shows 30% due to a forecast of light snow after the morning bus window. By 5 a.m., the storm has sped up and is now expected to peak at 7 a.m., right as buses load. A predictor recalculates this to 65%, while a calculator that only updated once overnight might still show the old 30% figure.
These examples show why the same snowfall total can mean very different things depending on location, timing, and how often the tool refreshes its data.
Read More : What Causes a Blizzard
Benefits and Use Cases
- Parents can plan childcare and morning routines the night before instead of waiting on a 5 a.m. phone alert
- Teachers and staff can prepare lesson plans for either a full day, a delay, or remote learning
- Students can decide whether to finish homework that night or gamble on an extra morning
- Commuters in the same district can use the same weather signals to judge road conditions, even without kids in school
- School administrators can cross-check their own internal weather briefings against an independent estimate
If wind chill is part of your concern rather than snow totals alone, our Wind Chill Calculator breaks down the "feels like" temperature separately, since extreme cold alone can trigger a closure even without snowfall.
Common Mistakes and Pro Tips
Common Mistakes
- Only checking once. A single evening check misses overnight shifts in a fast-moving storm.
- Ignoring timing. Total snowfall matters less than when the snow actually falls relative to the morning commute.
- Comparing your score to a friend's in another town. Two nearby districts can have very different plowing budgets and closure histories.
- Treating the percentage as a guarantee. The final call always comes from your school district, not the tool.
Pro Tips
- Check your score once before bed and once first thing in the morning
- Pay attention to the wind and ice numbers, not just the snowfall total
- Set your district's policy setting to match its real-world track record, not how you wish it behaved
- Use a predictor-style tool specifically when a storm is forecast to shift or intensify overnight
According to Maria Chen, a district transportation coordinator who consults with our editorial team, "the single biggest factor families overlook is bus route conditions on rural roads, which can lag well behind main-road plowing." That gap is part of why two similar-looking forecasts can lead to two very different decisions.
Comparison Table: Predictor vs Calculator vs Weather App
| Feature | Weather App | Snow Day Calculator | Snow Day Predictor |
|---|---|---|---|
| Shows snowfall totals | Yes | Yes | Yes |
| Factors in school district history | No | Yes | Yes |
| Adjusts for closure timing (overnight vs morning) | No | Sometimes | Yes |
| Refresh frequency | Hourly | 1 to 2 times per day | Every few hours |
| Gives a single closure percentage | No | Yes | Yes |
To see this in action for your own address, try our full calculator directory, which includes location-specific tools built on this exact model.
Conclusion
A snow day calculator and a snow day predictor are answering the same question with slightly different tools. Calculators give you a steady, rules-based estimate rooted in history. Predictors layer live weather data on top, so they react faster when a storm starts to shift. For most families, the smart move is checking a blended tool like ours once the night before and again the next morning, so you get both the historical steadiness and the real-time accuracy in one number. Try the calculator above to check your own snow day chances for tonight.