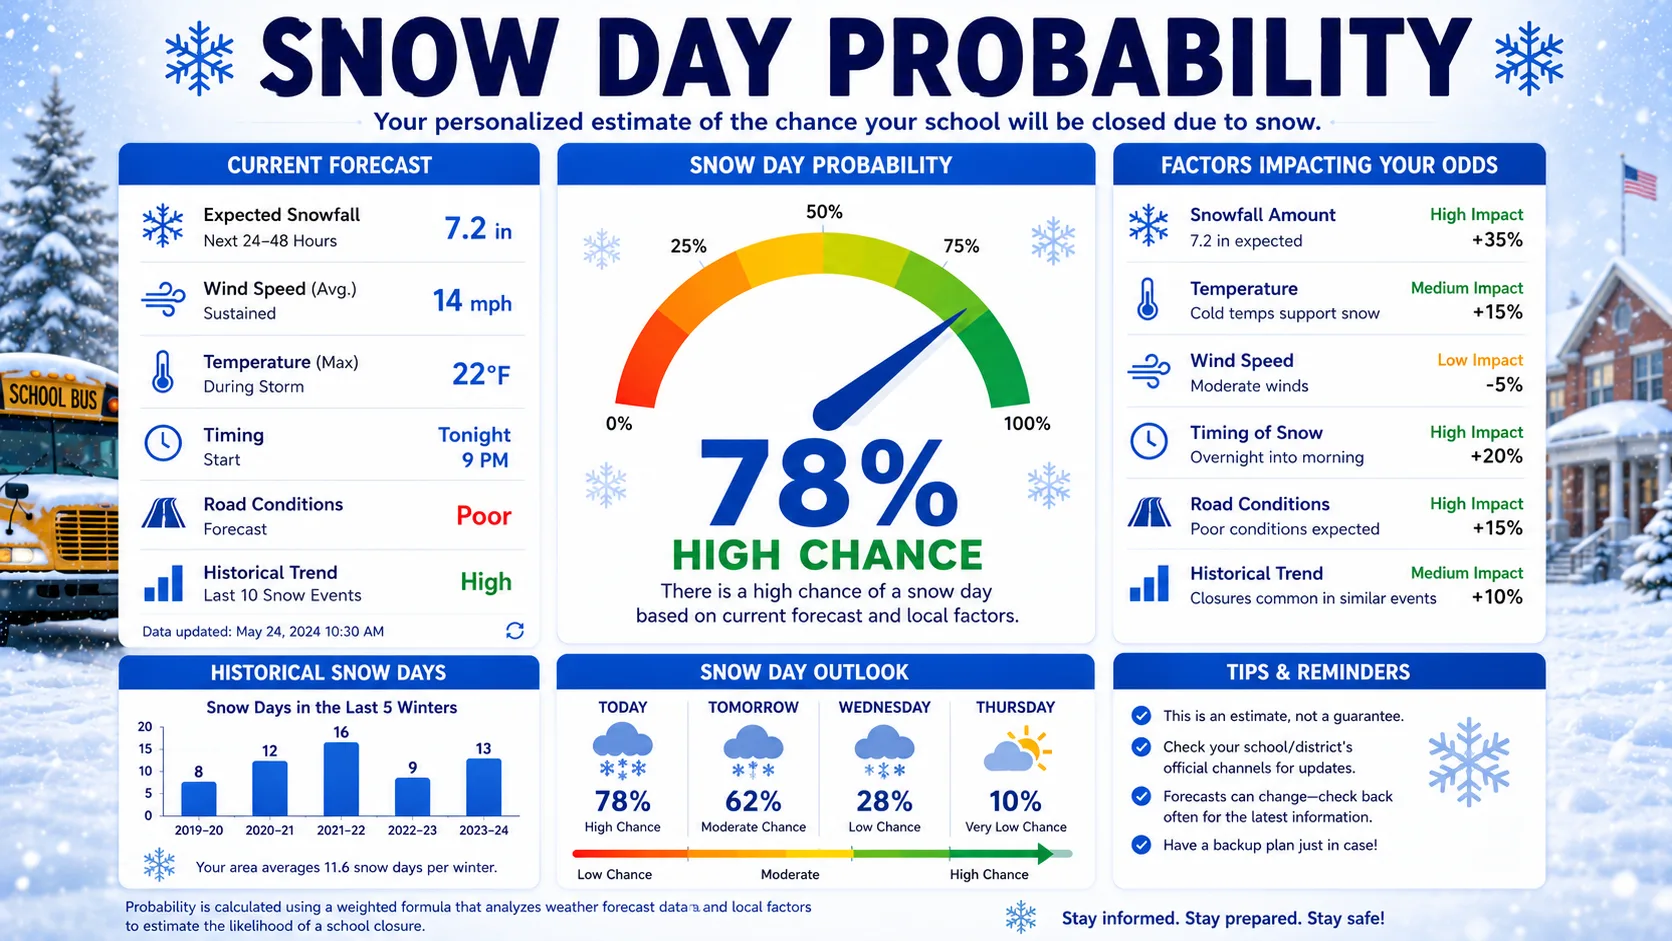
Snow day probability is a percentage, usually between 0% and 100%, that estimates how likely your school is to close, delay, or dismiss early because of winter weather. A 70% snow day probability does not guarantee a closure. It means that in similar past conditions, schools closed roughly 7 out of 10 times. Understanding that distinction is the single most useful thing you can take from this guide.
Most people see this number on a school closing calculator and assume it works like a weather forecast, either it will snow or it will not. It actually works more like a risk score. Below, we break down exactly what each percentage range means, why the number changes hour to hour, and how to use it to plan your day with confidence. You can check your live number on our School Snow Day Calculator while you read.
What Is Snow Day Probability
Snow day probability is a statistical estimate, not a prediction of certainty. It is built by comparing current weather conditions against how schools in your area responded to similar conditions in the past. The number represents likelihood, not a promise.
This is the single most misunderstood part of any school closing tool. A 30% probability does not mean school will "probably" stay open in some vague sense. It means that historically, out of every 10 similar situations, roughly 3 resulted in a closure and 7 did not. A 30% chance is genuinely possible. It is simply less likely than not.
The same logic applies at the high end. An 80% probability does not guarantee a closure. It means 8 out of 10 similar situations ended in a closure, which leaves real room for your specific school to stay open.
Where does the "similar situations" comparison actually come from? Most tools build this from a mix of live weather data and a historical record of confirmed school closures for your area, sometimes going back several years. When a new forecast comes in, the model looks for past storms with matching snowfall, temperature, timing, and ice conditions, checks how often schools closed in those matching cases, and reports that rate as your current probability. A district with a longer, more consistent closure history will generally produce a more stable, trustworthy percentage than one with limited past data.
It also helps to separate two ideas that sound similar but are not: forecast confidence and closure probability. Forecast confidence describes how sure meteorologists are about the snowfall total itself. Closure probability describes how likely that expected weather is to trigger an actual school closure, once local infrastructure, road conditions, and district history are factored in. A highly confident forecast for 2 inches of snow in Minneapolis might still produce a low closure probability, while a less confident forecast for 2 inches in Atlanta could produce a much higher one.
Key takeaway: Snow day probability describes risk, not certainty. Treat any percentage as a planning tool, and always confirm the final decision with your school district directly.
How the Percentage Is Calculated
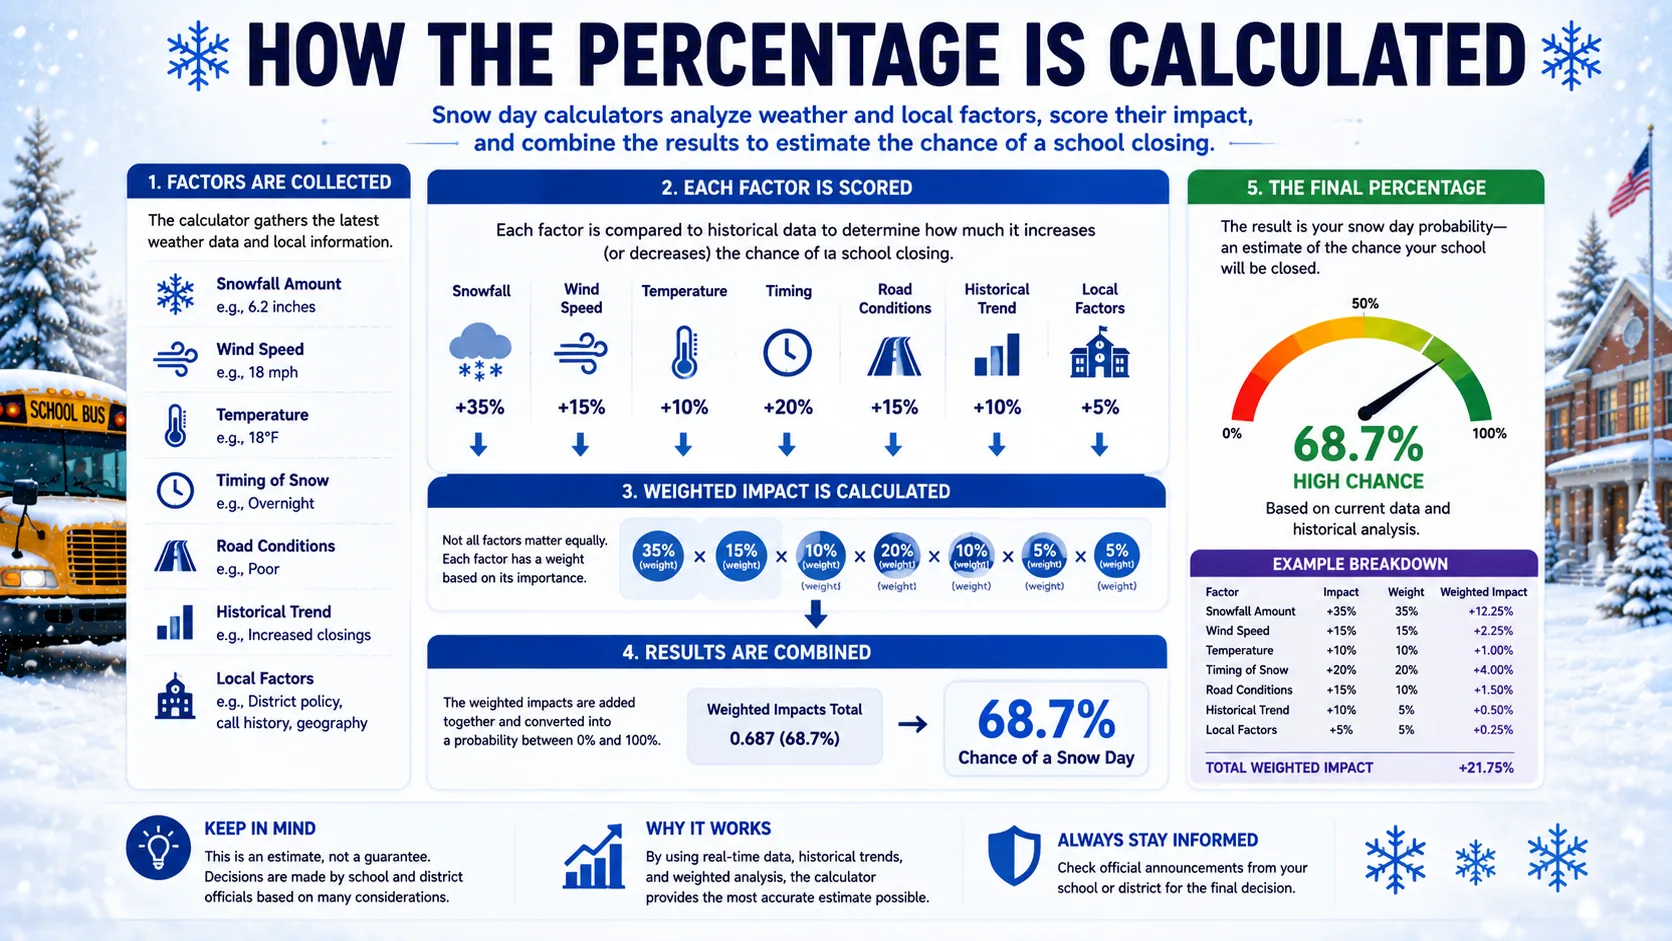
Snow day probability is generated by combining live weather data with location-specific closure patterns, then converting that combination into a single number.
The Weather Layer
Forecast tools pull in expected snowfall, ice accumulation, temperature, wind chill, and storm timing for your exact ZIP code or city, not a regional average.
The Local History Layer
The calculation also weighs how your specific district has responded to past storms. A district that has closed easily in the past nudges the percentage upward. A district known for staying open through most storms pulls it back down.
The Confidence Layer
Finally, the model accounts for how confident the forecast itself is. A storm 12 hours away with strong model agreement produces a more reliable percentage than one five days out, where different forecast models can still disagree. This is why your snow day probability often climbs steadily as the storm gets closer, even if the underlying weather barely changes.
You can think of these three layers as working together rather than separately. Weather sets the ceiling on how high a probability can realistically go. Local history shifts that ceiling up or down based on your district's own pattern. Forecast confidence determines how much you should trust the number at any given moment, with numbers checked further in advance deserving more skepticism than numbers checked the night before or the morning of the storm.
Because there is no single official government standard for this calculation, different tools may show slightly different percentages for the same storm. That is expected, not a sign that one tool is wrong.
What Each Probability Range Means
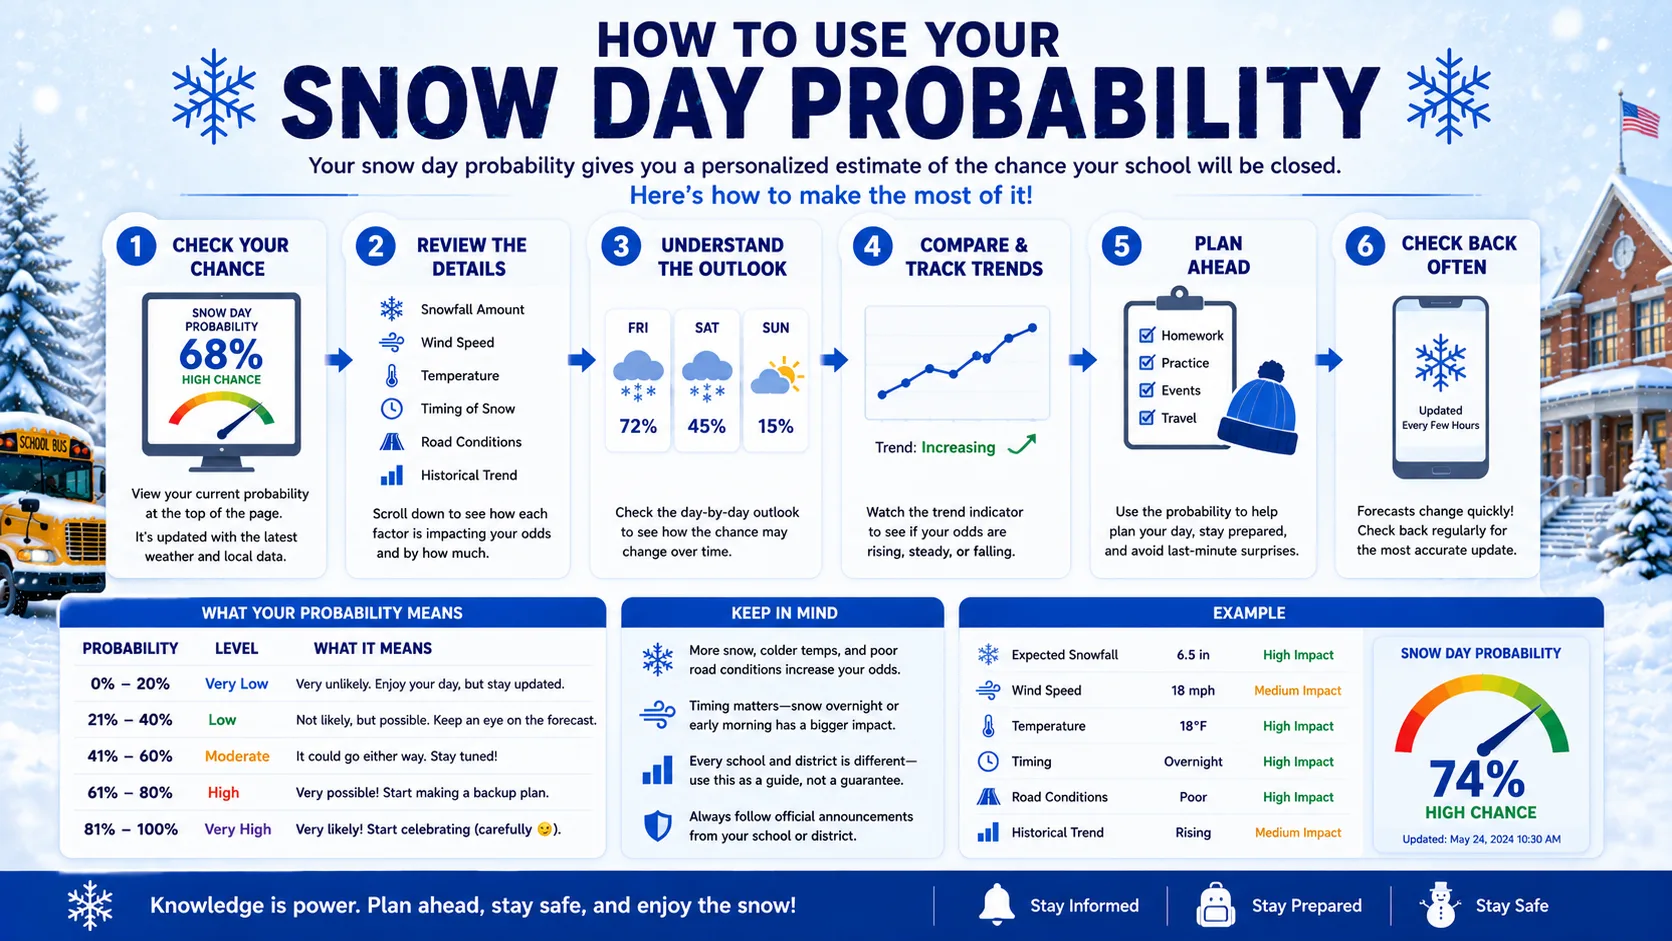
The table below shows the general meaning behind each range. These are typical interpretations used across most snow day tools, not an official district standard.
| Probability Range | What It Typically Means | Suggested Action |
|---|---|---|
| 0 to 19% | Very low risk. Weather conditions are mild or highly uncertain. | No special preparation needed. School will almost certainly run as normal. |
| 20 to 39% | Possible but unlikely. Light snow or timing uncertainty in the forecast. | Stay aware. Check again closer to the evening or morning. |
| 40 to 59% | Genuinely borderline. Conditions could reasonably go either way. | Prepare a backup plan for childcare or transportation, just in case. |
| 60 to 79% | Moderate to high risk. Weather is trending toward closure-level conditions. | Plan as if a delay or closure is likely. Confirm early the next morning. |
| 80 to 100% | High risk. Conditions strongly favor a closure or significant delay. | Expect a closure or delay. Watch for your district's official notice. |
Notice that the 40 to 59% range is not a flaw in the model. It reflects real, honest uncertainty, often the exact same uncertainty your school's own administrators are weighing at that moment.
It also helps to think of these ranges as a sliding scale rather than fixed boxes. A probability of 58% and a probability of 61% describe nearly identical real-world risk, even though one falls just inside the "borderline" range and the other just inside the "moderate to high" range. Focus on the general trend of the number over several hours rather than treating the exact boundary between ranges as meaningful on its own.
How to Use Your Snow Day Probability
Reading the number correctly takes a few extra steps beyond just glancing at a percentage.
- Check your exact location. Enter your ZIP code or city on our full calculator directory rather than relying on a regional guess.
- Note the time you checked. A probability checked three days out is far less reliable than one checked the night before.
- Compare it to the range table above. This tells you what level of preparation makes sense right now.
- Check again in the evening. Most reliable readings come between 6 and 10 p.m. the night before, once the overnight forecast has firmed up.
- Check once more early the next morning. Many districts finalize decisions between 5 and 6 a.m., so a final check around that window gives you the freshest number.
- Confirm with your district. Once the probability is high, watch for the official announcement instead of acting on the percentage alone.
For a breakdown of how much snow it typically takes to move the needle in your specific state, see our state-by-state prediction page.
Real-World Examples With Numbers
Example 1: Climbing Probability Overnight
At 6 p.m., a forecast shows 3 to 5 inches of snow starting after midnight, with real uncertainty about the exact starting time. The snow day probability sits at 45%, a genuinely borderline reading.
By 5 a.m., radar confirms the snow started on schedule and totals are tracking toward the higher end of the forecast. The probability climbs to 78%. Nothing about the storm itself changed dramatically. The forecast simply became more certain as the event unfolded, and the percentage moved with it.
Example 2: Two Districts, Same Storm, Different Numbers
A single winter storm drops 4 inches of snow across both a mid-sized city and a nearby rural county. The city, with a large plow fleet and a district that historically stays open through moderate snow, shows a 35% probability. The rural county, with longer bus routes and a district that has closed for similar storms before, shows a 65% probability for the exact same weather event.
This is a clear example of why snow day probability is never a single national number. Local infrastructure and closure history change the outcome as much as the storm does.
Example 3: A High Percentage That Still Stays Open
A forecast shows 6 inches of snow arriving overnight, producing an 82% probability, solidly in the "expect a closure" range. Overnight, the storm track shifts slightly south, cutting the actual snowfall to 2 inches by morning. The district, which had strong road crews on standby, opens on time.
This does not mean the 82% reading was wrong. It means an 82% probability leaves an 18% chance of staying open, and this storm happened to land in that smaller slice.
Example 4: Reading the Trend, Not Just the Number
A family checks their snow day probability three separate times before an expected storm. At noon, it reads 25%. At 6 p.m., it reads 38%. At 10 p.m., it reads 52%.
The single most useful piece of information here is not any one of those three numbers. It is the direction of the trend. A steadily climbing probability across the evening is a stronger planning signal than any single snapshot, since it shows the forecast tightening around a more likely closure as new data arrives.
Probability and the Three Possible Outcomes
A single snow day probability percentage usually maps to one of three outcomes, and it helps to know which one is most likely at each level.
- School stays open. Most common when probability sits below roughly 30 to 40%. Roads and safety conditions are considered manageable.
- Delay or early dismissal. Most common in the moderate 40 to 70% range, especially when overnight snow is expected to taper off before the morning commute.
- Full closure. Most common above roughly 70 to 80%, when snowfall, ice, or extreme cold combine to make travel genuinely unsafe.
Early dismissal is the hardest outcome to predict in advance, since it usually results from a storm that develops faster than expected during the school day itself, rather than something visible in an overnight forecast.
It is also worth noting that these three outcomes are not evenly distributed across every probability level in every region. A district with a large bus fleet and long rural routes may lean toward a delay rather than a full closure even at higher probability levels, simply because a two-hour delay lets roads get treated before buses run. A dense urban district with shorter routes may skip delays almost entirely and move straight from "open" to "closed" once conditions cross their threshold. Understanding your own district's typical pattern, not just the general national trend, will help you read your local probability more accurately over time.
If extreme cold rather than snowfall is driving your local risk, our Wind Chill Calculator breaks down how temperature alone can push a district toward closure even with clear skies.
Common Mistakes and Pro Tips
- Treating any percentage as a yes or no answer. A 70% chance still leaves a real 30% chance of staying open.
- Checking once and never again. Probability shifts as the forecast firms up. A single check three days out is only a starting point.
- Ignoring the confidence window. Numbers checked the night before or early the same morning are consistently more reliable than numbers checked days ahead.
- Comparing your number to a friend's in another town. Two nearby districts can show very different percentages for the exact same storm.
- Assuming a moderate percentage means the tool is unreliable. A 40 to 60% reading usually reflects genuine uncertainty, not a broken model.
- Sharing a screenshot from earlier in the day as if it is still current. A probability from 8 a.m. can look very different by 8 p.m. once the evening forecast update arrives, so always check the timestamp before acting on a number someone else sent you.
Pro tip: If your snow day probability sits in the 40 to 60% range the night before, prepare a backup plan for the morning rather than waiting to see if the number moves. That range is exactly where district decisions are hardest to predict, for the calculator and for the superintendent alike.
Read More : School Closing Calculator
Snow Day Probability vs. a Simple Yes or No
Some tools try to simplify things into a plain yes or no closure guess. That approach throws away useful information.
| Approach | What It Tells You | Limitation |
|---|---|---|
| Simple yes/no guess | A single, confident-sounding answer | Hides genuine uncertainty and is often wrong in borderline conditions |
| Snow day probability percentage | A graded estimate of risk based on weather and local history | Requires understanding that percentages describe likelihood, not certainty |
| Official district announcement | The confirmed, final decision | Not available until the night before or early morning |
A percentage-based approach is more honest about what a prediction tool can actually know in advance. It lets you plan proportionally to the real risk instead of reacting to an overconfident guess.
This is also why probability-based tools tend to earn more trust over a full winter season than simple yes-or-no predictors. When a yes-or-no tool gets a borderline call wrong, it looks broken. When a probability-based tool shows 45% and school happens to stay open, it was still accurate, since 45% always meant "more likely than not to stay open, but genuinely close." Judging a probability tool over many storms, rather than a single call, is the fairest way to evaluate how well it actually performs.
Conclusion
Snow day probability gives you something more useful than a guess. It gives you a graded, location-specific estimate of real risk, built from the same weather and closure patterns your district itself is weighing. Understanding what each range actually means, rather than reading it as a simple yes or no, is what makes the number genuinely useful for planning.