A snow day tracker shows you the live probability that your school will close, delay, or stay open tomorrow, based on real-time snowfall, ice, temperature, and road-condition data for your ZIP code. Instead of refreshing your school district's website at 5 a.m., you get a single, data-based number in seconds. This guide explains exactly how a snow day tracker works, how to read the results, and how to get the most accurate prediction for your area.
If you just want the fast answer, head to the snow day tracker on our homepage, enter your ZIP code, and you'll see your closure odds right away. The rest of this guide walks through the details, the science, and the common mistakes people make when reading their results.
What Is a Snow Day Tracker
A snow day tracker is an online tool that estimates the chance your school will be closed, delayed, or dismissed early because of winter weather. It pulls live forecast data for your exact location and turns it into a simple percentage, so you don't have to interpret raw weather maps yourself.
Most trackers, including ours, combine three types of information:
- Live weather forecasts for your ZIP code, including snowfall totals, ice accumulation, and wind chill
- Local closure history for how your district has responded to past storms
- Regional thresholds that account for how much snow is "normal" in your area
This last point matters more than most people realize. A snow day tracker is not just a weather forecast. It's a weather forecast filtered through what your specific district considers disruptive.
How a Snow Day Tracker Works
Behind the simple percentage you see on screen, a snow day tracker is running several weather variables through a weighted model. Here are the factors that carry the most weight.
Snowfall Amount and Rate
Total expected snowfall matters, but so does how fast it falls. Two inches over twelve hours is manageable for road crews. Two inches in ninety minutes during the morning commute is a much bigger problem, even though the total is the same.
Ice and Mixed Precipitation
Ice is often the single biggest factor in a closure decision. A thin glaze of ice on untreated roads and sidewalks can shut down bus routes even when the actual snowfall total looks minor.
Temperature and Wind Chill
Extreme cold can trigger a closure on its own, even without snow, because waiting at a bus stop becomes dangerous. If wind chill is a factor where you live, our wind chill calculator can help you see exactly how cold it will feel at bus-stop hours.
Storm Timing
A storm that peaks during the overnight hours and clears by sunrise is far less disruptive than one that hits right as buses are loading. Snow day trackers weigh the timing of the worst conditions relative to your school's start time.
Local Climate and District History
Districts in snowier regions have more equipment, more experienced drivers, and a higher tolerance for snow before they close. Districts that rarely see snow often close for amounts that wouldn't register as a threat further north.
| Region Type | Snow Amount That Often Triggers a Closure | Why |
|---|---|---|
| Southern / rare-snow districts | 1 to 2 inches | Little to no plowing or salting equipment |
| Mid-Atlantic / Midwest | 4 to 6 inches, or any ice | Moderate equipment, but rural bus routes are a risk |
| Northeast / Great Lakes | 8 to 12+ inches, or dangerous wind chill | Heavy equipment and experience with routine snowfall |
| Mountain West | Variable, driven mostly by ice and visibility | Elevation and terrain matter more than total snowfall |
These are general patterns, not fixed rules. Your own district's history is the best guide, which is why a snow day tracker that factors in local closure data tends to be more accurate than a raw weather forecast alone.
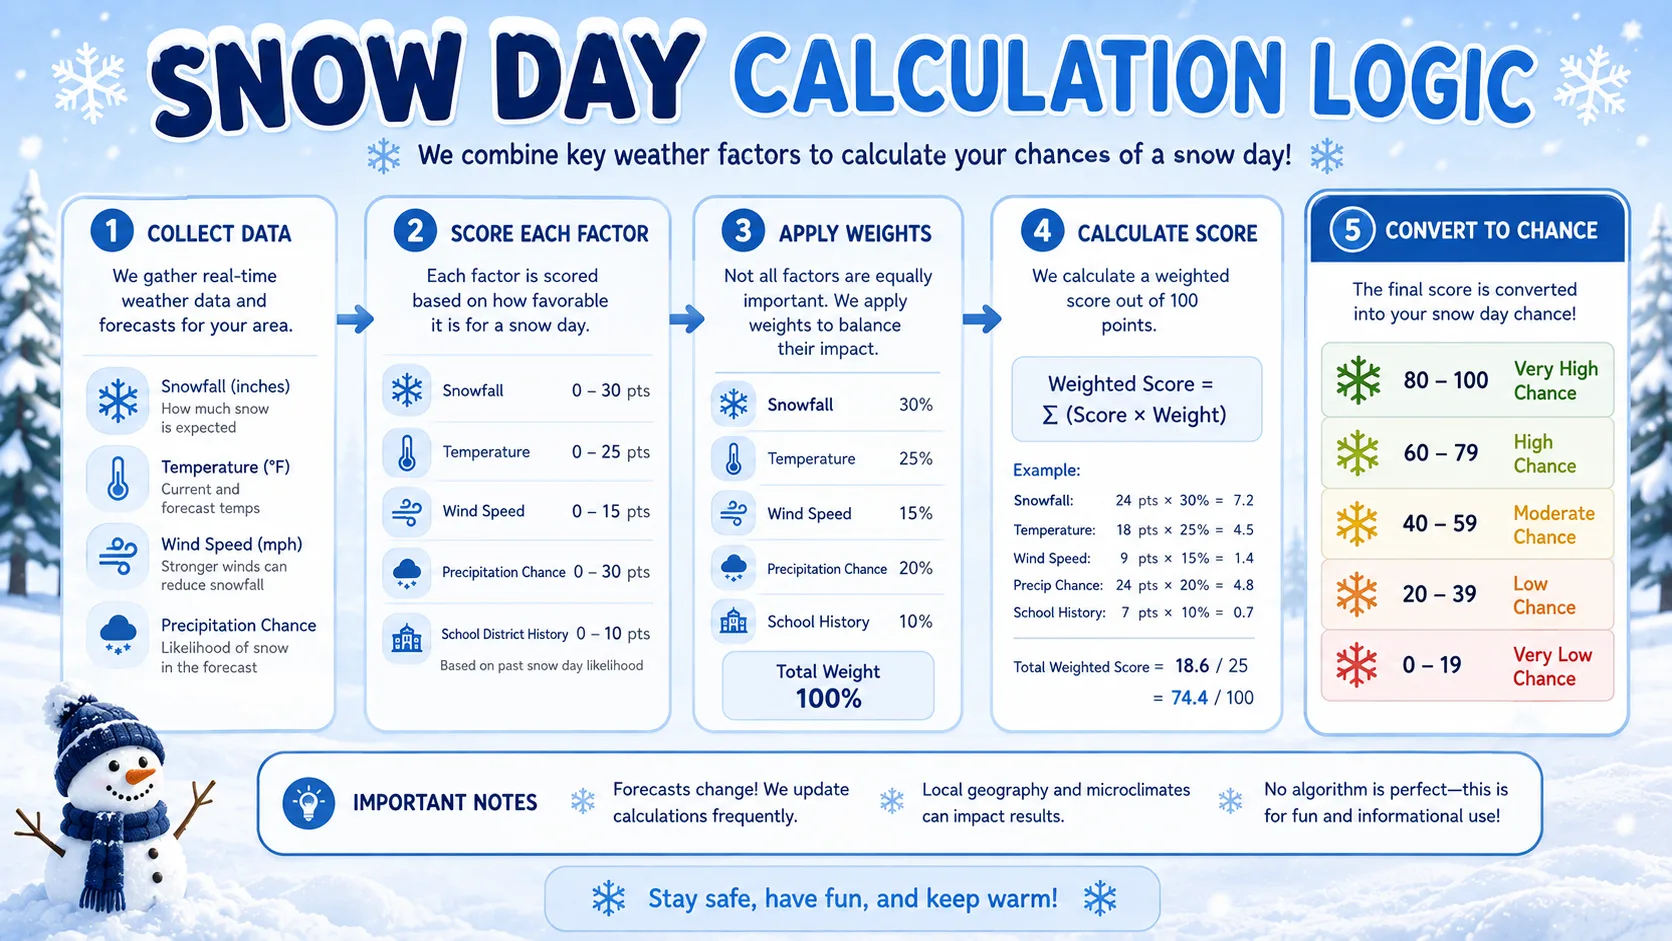
The Snow Day Calculation Logic, Simplified
You don't need to understand meteorology to use a snow day tracker, but knowing the basic logic helps you interpret the number you're given. In general terms, the model works like this:
- Start with a baseline score of 0%.
- Add points for expected snowfall, scaled to what's unusual for your region.
- Add a larger weight for any ice or freezing rain in the forecast.
- Add points for dangerously low wind chill during morning commute hours.
- Adjust the total up or down based on your district's documented closure history.
- Cap and round the result into a percentage you can actually act on.
The National Weather Service publishes local forecast data that most trackers, including ours, pull from directly, which is part of why accuracy tends to improve as a storm gets closer. A prediction made three days out will always carry more uncertainty than one made the night before.
Step-by-Step Guide to Using the Snow Day Tracker
Getting an accurate reading takes less than a minute. Here's the exact process.
- Go to the tracker. Open the snow day tracker on your device.
- Enter your ZIP code. This locates your nearest weather station and matches you to the closest district-level data available.
- Select your school type, if asked. Public, private, and rural districts often have different closure thresholds, and some tools let you refine your result this way.
- Read your percentage and the factor breakdown. Look past the headline number and check which factor (snow, ice, or cold) is driving your score.
- Check back closer to the storm. Predictions firm up as the event gets closer, especially inside the 12 to 24 hour window before school starts.
- Compare with your district's own alerts. A tracker gives you an early, independent estimate, but your district's official announcement is always the final word.
Benefits and Use Cases
A snow day tracker is useful well beyond students hoping for a day off. Different groups use it for different reasons.
- Parents use it to line up child care or adjust work schedules the night before, instead of scrambling at 6 a.m.
- Students use it to decide whether to finish that assignment tonight or risk it.
- Teachers use it to plan lesson pacing and avoid prepping a full day that gets cancelled.
- Bus drivers and school staff use it to anticipate early call times and route changes.
- Commuters near schools use it to plan around the traffic patterns that shift on delay or closure days.
You can browse our full calculator directory if you also want related tools, like commute-timing or weather-severity calculators, in one place.
Real-World Examples With Numbers
To show how the same storm produces different results, here's how three hypothetical districts might score against an identical incoming system: 5 inches of snow, light ice glaze before dawn, and a wind chill of 10°F at bus time.
| District Example | Typical Winter | Estimated Closure Chance |
|---|---|---|
| Coastal Georgia district | Rarely sees snow | 90 to 95% |
| Mid-Atlantic suburban district | A handful of snow events per year | 65 to 75% |
| Upstate New York rural district | Routine heavy snowfall all winter | 20 to 30%, driven mostly by the ice glaze |
Notice that the third district's chance is still meaningfully above zero, not because of the 5 inches of snow, which it can handle easily, but because of the ice. That's a good example of why checking the factor breakdown matters more than the headline percentage.
Common Mistakes and Pro Tips
Mistake: Checking Too Early and Assuming It's Final
A prediction made 72 hours out can shift a lot. Treat early checks as a heads-up, not a guarantee, and check again the evening before.
Mistake: Ignoring Ice in Favor of Snow Totals
Many people focus only on inches of snow. Ice and mixed precipitation are often the bigger driver of a closure, especially in regions that don't see much snow. If a storm looks likely to shift to rain or a wintry mix, our rain delay calculator can help you track that transition separately.
Mistake: Comparing Your District to a Neighboring One
Two districts fifteen minutes apart can make completely different calls based on their bus routes and terrain. Use your own district's history, not a neighbor's, as your benchmark.
Pro Tip: Check Between 5 and 6 A.M.
Most districts announce closures by 6 a.m., and overnight forecast updates tend to sharpen the prediction significantly in the few hours before that window.
Pro Tip: Watch the Trend, Not Just the Number
If your percentage is climbing every time you check, that's often more informative than the number itself. A rising trend usually means the storm track has shifted toward your area.
Read More : Snow Day Probability
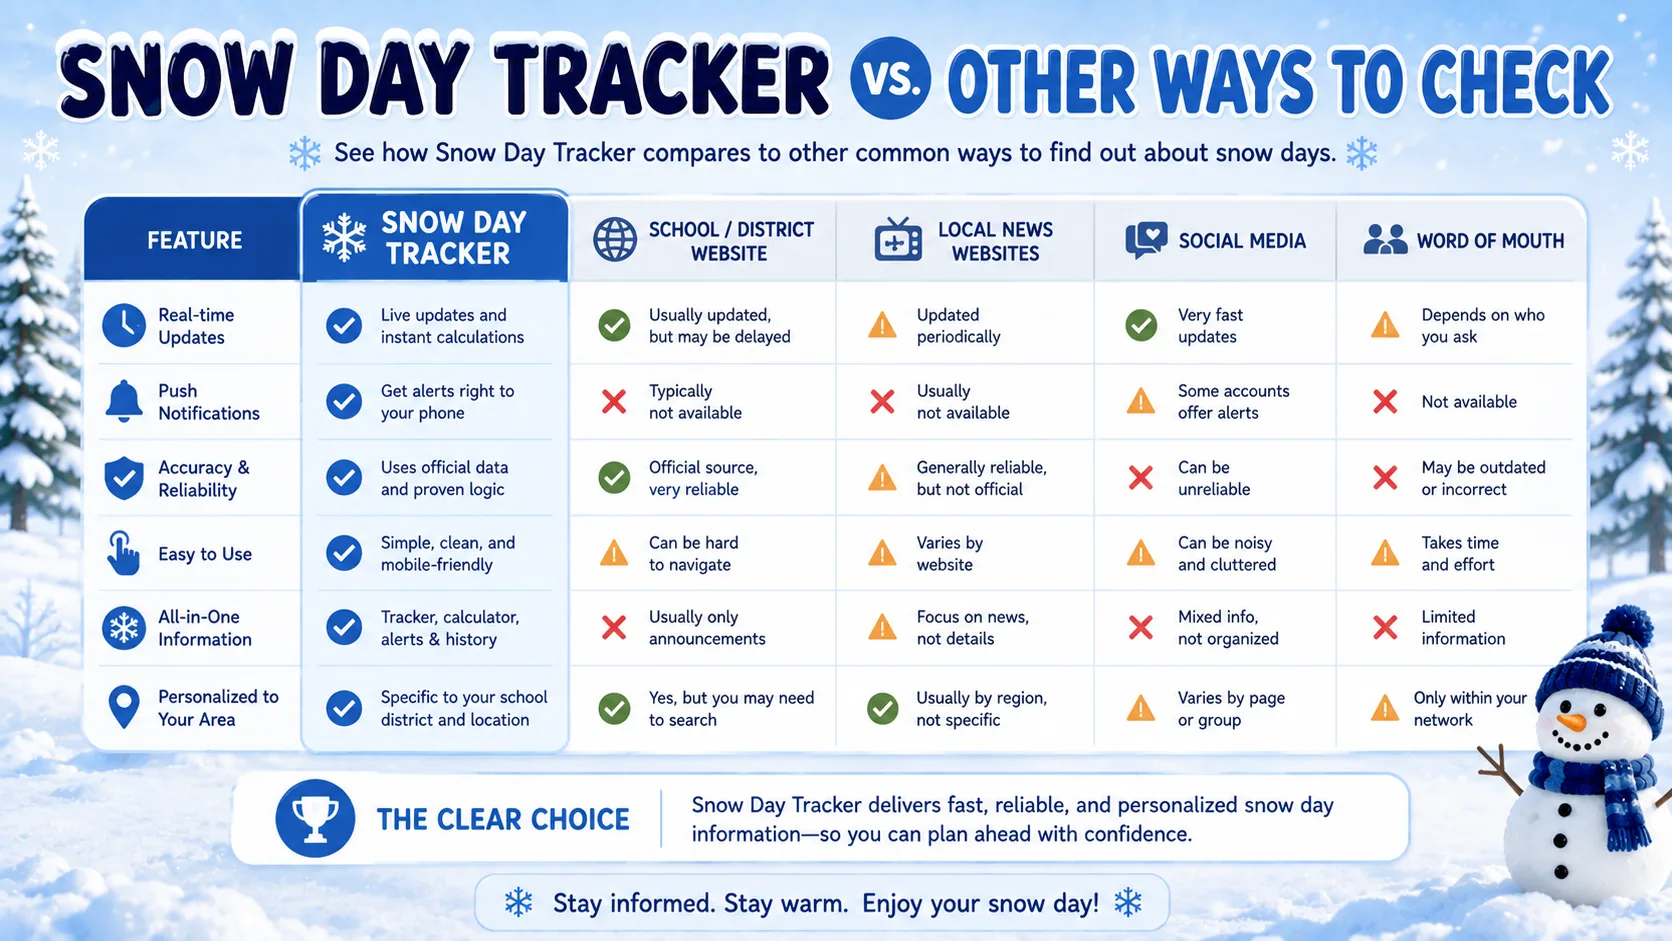
Snow Day Tracker vs. Other Ways to Check
| Method | Speed | Personalized to Your District | Factors Snow, Ice, and Cold Together |
|---|---|---|---|
| Snow Day Tracker (ZIP-based) | Instant | Yes | Yes |
| General weather app | Instant | No | Partially, usually snow only |
| District website or robocall | Often not until early morning | Yes, but only after the decision is made | N/A, it's an announcement, not a forecast |
| Social media rumors | Instant, but unreliable | No | No |
A general weather app tells you what the sky is doing. It won't tell you whether that translates into a closure for your specific school. That gap is exactly what a snow day tracker is built to close.
What Meteorologists and Districts Actually Say
Meteorologists who cover winter weather consistently point out that closures are driven by road safety, not raw snowfall numbers. A commonly cited guideline from local National Weather Service forecast offices is that ice accumulation of even a quarter inch can make roads more hazardous than six inches of dry, powdery snow.
Education officials tend to echo the same idea from a different angle. Superintendents interviewed by regional news outlets during major storms routinely emphasize that the decision comes down to whether buses can run their full routes safely by the scheduled pickup time, not whether school itself would be pleasant to attend in the snow.
That's exactly why a good snow day tracker weighs road-relevant factors like ice, wind chill, and storm timing as heavily as it weighs the total snowfall number.
State-by-State Differences Worth Knowing
Snow day thresholds vary enormously by state, and even by county within a state. A district in coastal Alabama and a district in northern Vermont are working from completely different playbooks. If you're curious how your state generally compares, you can browse our state-by-state snow day predictions for a broader regional view before narrowing down to your ZIP code.
Conclusion
A snow day tracker turns a stressful guessing game into a quick, data-based check you can run from your phone. By combining live snowfall, ice, temperature, and your district's own closure history, it gives you a far more useful answer than a generic weather forecast ever could. For more winter-weather planning tools and guides, visit our blog. Try the snow day tracker above and check your odds before the next storm rolls in.