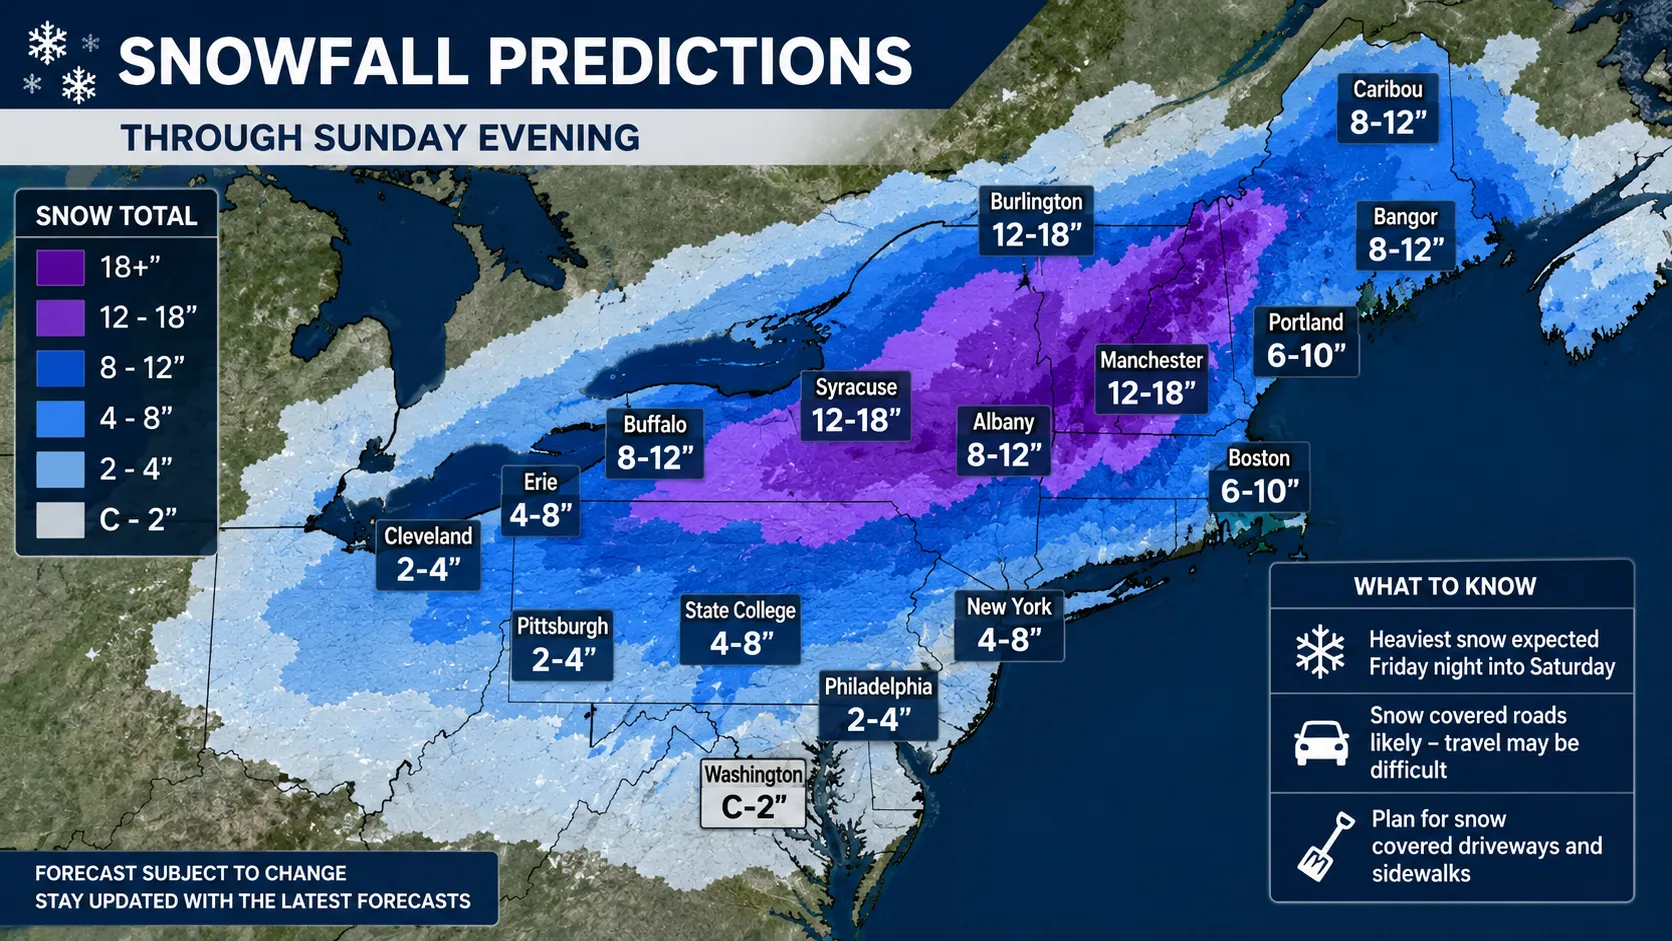
Snowfall predictions tell you how much snow is expected to fall in your area, when it will start and stop, and how confident forecasters are in that estimate. The best predictions combine live radar data, atmospheric models, and local terrain patterns to give you a usable number, not just a vague "chance of snow."
If you have ever refreshed a weather app five times in one evening trying to figure out whether tomorrow brings two inches or twelve, this guide is for you, whether you are a parent checking on tomorrow's commute, a school administrator weighing a delay, or just someone who wants to know how much shoveling is coming. Below, we break down exactly how snowfall predictions are built, how to read them correctly, and how to use a snowfall prediction calculator to plan your day with confidence.
What Are Snowfall Predictions?
Snowfall predictions are estimates of how many inches or centimeters of snow will accumulate in a specific location over a set period, usually the next 24, 48, or 72 hours. They are generated by combining weather model output, real-time radar tracking, and historical accumulation patterns for that region.
Unlike a simple "will it snow" alert, a full snowfall prediction includes several pieces of information working together:
- Total accumulation range (for example, 3 to 6 inches)
- Start and end time of the snow event
- Snow rate, meaning how fast it falls per hour
- Confidence level, which reflects how much models agree with each other
- Storm type, such as a clipper system, coastal nor'easter, or lake-effect band
Meteorologists at the National Weather Service and private forecasting services update these numbers as new data comes in, which is why a prediction posted three days out often looks different from the one posted the night before the storm.
It helps to think of a snowfall prediction less like a single answer and more like a snapshot of the best available evidence at that moment. As a storm gets closer, forecasters have more real-time data to work with, so the range narrows and the confidence rating typically climbs. This is the same reason a five-day outlook might say "possible snow, 2 to 10 inches" while the morning-of update says "6 to 8 inches, high confidence."
How Snowfall Predictions Work
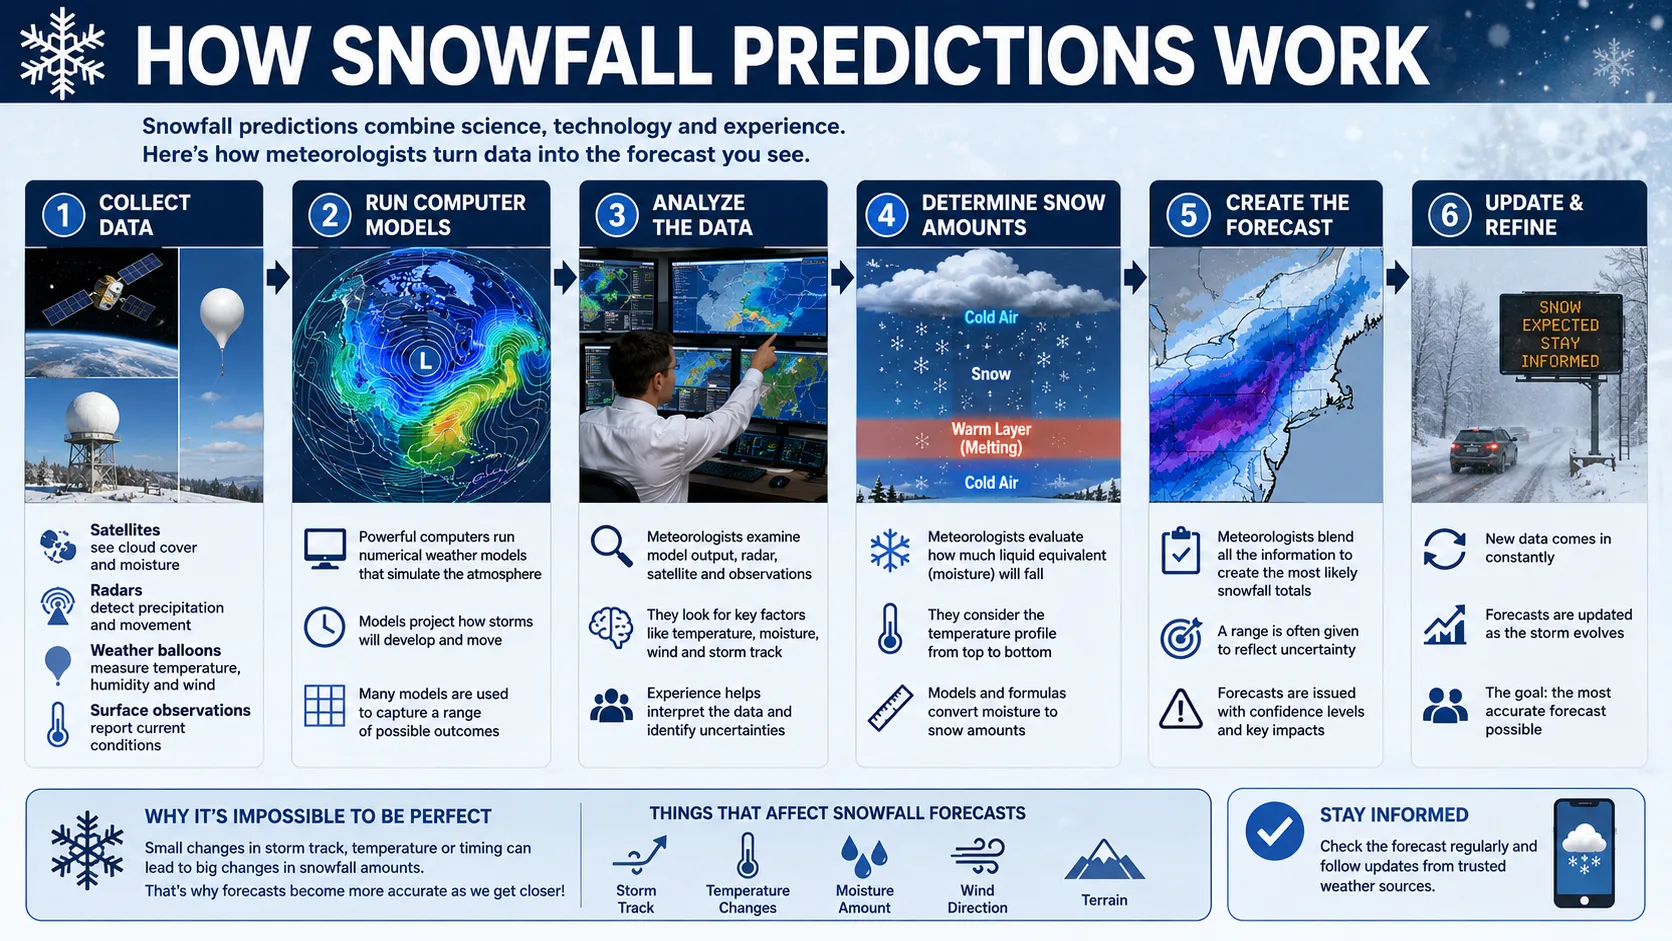
Every snowfall prediction starts with the same basic question: how much moisture is available, and how much of it will fall as snow rather than rain or ice. Forecasters answer that question using a mix of satellite data, radar, and computer modeling.
The Data Sources Behind Every Forecast
Modern snowfall predictions pull from several live data streams at once:
- Doppler radar, which tracks precipitation intensity and movement in real time
- Weather balloons that measure temperature, humidity, and wind at different altitudes twice a day
- Surface weather stations reporting current temperature, dew point, and pressure
- Satellite imagery showing cloud formation and storm structure from above
All of that raw data feeds into computer models that simulate how the atmosphere will behave over the next several days.
The Models That Generate the Numbers
Three models dominate American snowfall forecasting: the GFS (Global Forecast System), the NAM (North American Mesoscale model), and the European ECMWF model. Each one processes the same atmospheric data slightly differently, which is why you sometimes see conflicting snow totals from different weather sources.
Forecasters compare these models, weight them based on which has performed best in similar past setups, and blend the results into a single public prediction. This is also the point where local knowledge matters most, since a forecaster familiar with how a specific valley or coastline behaves during storms can adjust the raw model output accordingly.
How Often Predictions Update
Major models like the GFS and NAM refresh multiple times per day, typically every six hours, while newer high-resolution models can update even more frequently. Each new run absorbs the latest radar and station data, which is why a forecast checked at 6 a.m. can look noticeably different by 6 p.m. the same day.
Meteorologists generally note that the National Weather Service treats snowfall forecasts as a living estimate that sharpens as a storm gets closer, rather than a fixed prediction set days in advance. This is also true of automated calculator tools, which pull fresh model output on every page refresh instead of relying on a single static forecast.
Snowfall Predictions by Region
Snowfall predictions do not behave the same way everywhere. Regional geography changes how storms form, move, and drop snow, which is why the same weather system can produce very different totals just a few states apart.
Northeast and Coastal Storms
Nor'easters draw moisture from the Atlantic Ocean, often producing heavy, wet snow with lower snow-to-liquid ratios. These storms can intensify quickly, a process meteorologists call bombogenesis, which makes the 24 to 48 hour window especially important for accurate totals in this region.
Midwest and Great Lakes Snowfall
Lake-effect snow is unique to areas downwind of the Great Lakes. Cold air moving over relatively warmer lake water picks up moisture and dumps it as intense, narrow bands of snow. These bands can produce a foot of snow in one town while a town ten miles away sees almost none, making hyper-local prediction tools especially valuable here.
Mountain West and Elevation-Driven Snow
In mountainous regions, elevation is often the biggest factor in a snowfall prediction. A valley town might see rain while a ski resort just a few thousand feet higher sees heavy snow from the same storm. Predictions in these areas typically include an elevation-based range rather than a single town-wide number, and it is common to see two very different forecasts issued for a single county depending on which side of a mountain pass a town sits on.
Southern and Transition Zone Snow
Areas that see snow only occasionally, such as parts of the South and mid-Atlantic, face a different challenge: infrastructure. Even a modest snowfall prediction of 1 to 2 inches can carry outsized impact in a region with few plows and little road-salting experience, which is why local closure thresholds matter as much as the raw forecast number.
Because regional patterns vary this much, it is worth comparing your local forecast against nearby areas using our state-by-state predictions page before finalizing weekend or travel plans.
The Formula Behind Snowfall Forecasting
At its core, a snowfall total comes from converting expected precipitation into an equivalent depth of snow. This conversion is called the snow-to-liquid ratio, and it is the single most important variable in any snowfall prediction.
Understanding the Snow-to-Liquid Ratio
The basic relationship looks like this:
Expected snowfall = Liquid precipitation (inches) × Snow-to-liquid ratio
A common baseline ratio is 10:1, meaning one inch of liquid precipitation produces roughly ten inches of snow. But that ratio is not fixed. Very cold, dry air can push the ratio to 15:1, 20:1, or even higher, producing light, fluffy snow. Warmer air closer to the freezing point often produces a wetter, heavier snow with a ratio closer to 8:1 or lower.
The Key Variables That Change the Total
Beyond the ratio itself, four variables most often separate an accurate forecast from a missed one:
- Air temperature at the surface and at the level where snow forms
- Storm track, since a shift of even 50 miles can move a region from heavy snow to rain
- Moisture availability, which determines how much precipitation exists in the first place
- Elevation and terrain, since higher ground and coastal proximity change snow behavior significantly
This is exactly why a calculator that pulls live, location-specific data will consistently outperform a generic regional forecast.
Temperature deserves special attention because it works at two different levels. Surface temperature determines whether snow melts as it lands, while the temperature higher in the atmosphere, where the precipitation actually forms, determines whether it starts as snow in the first place. A storm can have cold air at the surface but a warm layer several thousand feet up, producing sleet or freezing rain instead of the snow a surface-only forecast might suggest.
How to Use a Snowfall Prediction Calculator
Getting a personalized snowfall forecast takes less than a minute. Here is the step-by-step process using the calculator directory at TheSnowDayCalculators.com.
- Enter your ZIP code or city. This pulls live weather station and radar data specific to your location instead of a broad regional average.
- Select your forecast window. Choose whether you want the next 24 hours, 48 hours, or the extended outlook.
- Review the accumulation range. Look at the low and high inches shown, not just the midpoint number.
- Check the confidence rating. A high-confidence forecast means the major weather models agree; a low-confidence one means the total could shift.
- Compare against your state page. Use our state-by-state predictions to see how your area compares to nearby regions during the same storm.
- Check back closer to the event. Snowfall predictions tighten and become more reliable inside the 24-hour window before a storm.
- Bookmark your ZIP code page. Returning to the same saved result lets you track how the range and confidence rating shift run over run, instead of starting from scratch each time.
Most people find it useful to check the calculator twice: once the evening before a possible storm to plan ahead, and again first thing in the morning to confirm timing before heading out the door.
Read More : Black Ice Dangers
Why Snowfall Predictions Matter
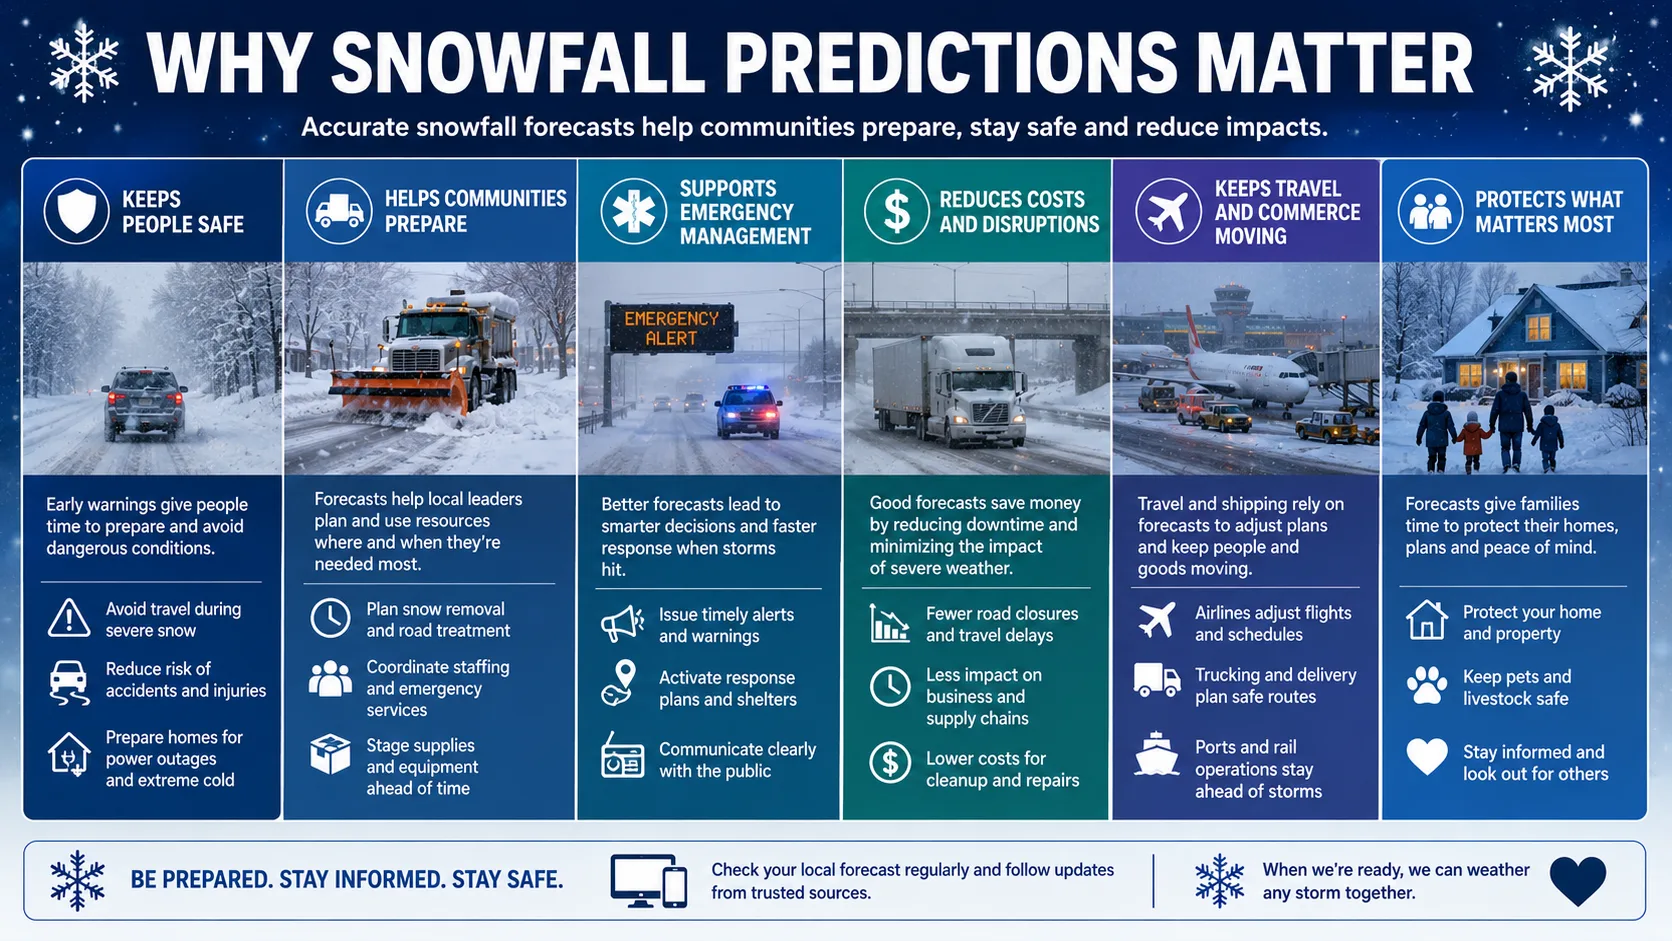
Accurate snowfall predictions do more than settle a curiosity. They shape real decisions for families, schools, and local businesses.
- School planning: Districts use snowfall totals, timing, and road conditions to decide on delays or closures.
- Commute safety: Knowing when snow rates peak helps drivers avoid the worst hour on the road.
- Event and travel decisions: Families and businesses can reschedule around confirmed high-accumulation windows instead of guessing.
- Emergency preparedness: City crews use predicted totals to time salting, plowing, and staffing.
- Outdoor recreation: Skiers and snow sport fans track fresh accumulation totals at nearby resorts.
These use cases share a common thread: the earlier someone spots a meaningful accumulation range, the more time they have to make a good decision instead of a rushed one. That is true whether the decision is a school district's call at 5 a.m. or a family deciding whether to leave for a weekend trip a day early.
Because so much depends on getting the number right, it helps to see how these predictions play out with real numbers.
Real-World Examples: Reading a Snowfall Forecast
Here is how three different snowfall setups can look on paper, and what each one typically means on the ground.
| Forecast Type | Predicted Range | Snow-to-Liquid Ratio | What It Usually Means |
|---|---|---|---|
| Light clipper system | 1 to 3 inches | 12:1 | Quick-moving, minor travel impact, unlikely to close schools alone |
| Moderate coastal storm | 4 to 8 inches | 10:1 | Meaningful accumulation, common threshold for school delays |
| Major winter storm | 10+ inches | 14:1 | High likelihood of closures, plowing delays, and travel advisories |
Notice that the moderate coastal storm example uses a lower ratio than the light clipper. That is because coastal storms often bring warmer, wetter air, producing heavier snow per inch of liquid, while a fast-moving clipper in colder inland air tends to produce fluffier snow at a higher ratio.
The major winter storm example illustrates why totals of 10 inches or more get flagged well in advance. Storms in this category usually combine a slow-moving system with a steady moisture supply, which gives snow more time to accumulate compared to a fast-moving clipper that passes through in just a few hours.
[Suggested image placement: A labeled chart showing three snowstorm types and their accumulation ranges, alt text: "snowfall predictions comparison chart showing light, moderate, and major winter storm accumulation ranges"]
Common Mistakes and Pro Tips
Common Mistakes When Reading Snowfall Predictions
Most confusion around snowfall predictions comes down to reading them the wrong way, not the forecast itself being wrong. These are the mistakes we see most often.
- Trusting a single number instead of the range. A forecast of "6 inches" is really shorthand for a range like 4 to 8 inches.
- Ignoring the confidence level. A low-confidence forecast five days out should be treated as a rough outlook, not a plan.
- Comparing apples to oranges. Totals from a national weather app and a hyper-local calculator can differ because they use different station data.
- Checking only once. Snowfall predictions update as new radar and model runs come in, especially inside 24 hours of the storm.
- Assuming every storm behaves like the last one. A nor'easter, a lake-effect band, and a mountain storm all follow different rules, so the same "inches expected" number can mean very different real-world conditions.
Pro Tips for More Reliable Results
- Check predictions the night before and again the morning of the event for the tightest possible range.
- Watch the storm track more than the total. A shift of the track matters more than small changes in the snow-to-liquid ratio.
- Pair snowfall totals with temperature. Use our wind chill calculator alongside your snow forecast to understand the full safety picture during a storm.
- Use your state's historical closure pattern. Some districts close at 2 inches, others rarely close under 6, so pair the raw prediction with your area's typical threshold.
Snowfall Prediction Tools Compared
| Tool Type | Update Frequency | Best For | Limitation |
|---|---|---|---|
| ZIP-code snowfall calculator | Hourly | Personalized, location-specific totals | Requires an internet connection to refresh |
| National weather app | Every few hours | Quick, general regional outlook | Less precise for small or rural towns |
| Extended 7 to 10 day outlook | Daily | Early trip and event planning | Low confidence beyond day 3 |
For day-of accuracy, a location-specific calculator paired with a same-day check almost always outperforms a generic app glance. Explore our full calculator directory to combine snowfall totals with related tools like the rain delay calculator for mixed winter precipitation events.
None of these tools are meant to replace an official forecast from your local weather service or a closure announcement from your school district. Instead, they are meant to give you a head start, so you are not caught off guard when the official word comes in.
Conclusion
Snowfall predictions give you a practical way to plan around winter weather instead of reacting to it at the last minute. By understanding how the snow-to-liquid ratio works, checking the confidence level alongside the total, and rechecking your forecast as the storm approaches, you can read any snowfall prediction with far more confidence.