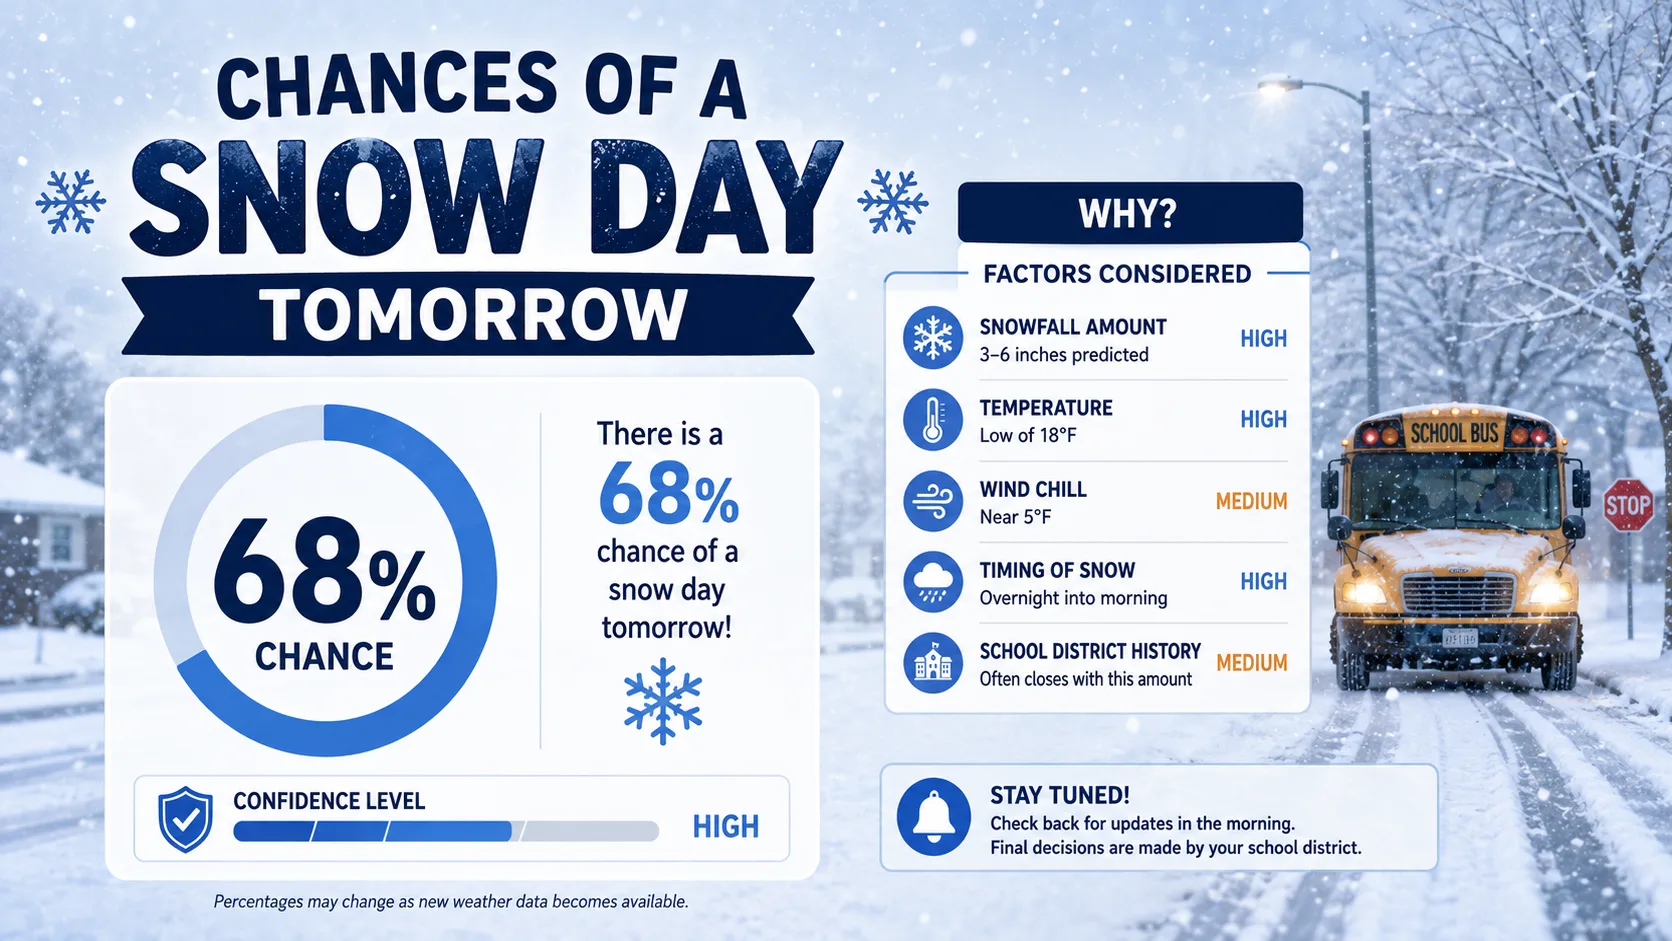
The fastest way to answer what are the chances of a snow day tomorrow is to plug your zip code into a snow day calculator, which turns your local forecast into a single percentage, something like a 72% chance of closure, based on the same variables districts weigh before they make the call. That number is not a guarantee, but it gives you a far sharper read than staring at a snow total alone.
This guide explains exactly how that percentage gets built, what different ranges actually mean, and when to check the number so you are not caught off guard in the morning. Whether you are a parent trying to plan childcare, a teacher deciding whether to finish grading tonight, or a student hoping for a surprise day off, a clear percentage beats a vague guess every time.
What a Snow Day Percentage Actually Measures
A snow day percentage is not a weather forecast. It is a probability score that compares tomorrow's forecast against the conditions that have historically caused school closures in your specific area.
That distinction matters. A weather app might tell you three inches of snow are expected. A snow day calculator takes that same three inches and asks a different question: given your district's roads, equipment, and past closure decisions, how often has three inches like this actually shut schools down before?
This is also why a percentage from one district cannot be compared directly to a percentage from another. A **70% chance** in a district that rarely closes for snow reflects a genuinely serious storm. The same 70% in a district with a low closure threshold might reflect a fairly ordinary winter morning.
It also helps to think of the percentage as a snapshot rather than a fixed prediction. Weather models update every few hours, and a snow day calculator refreshes its score each time new data comes in. The number you check at dinnertime is a reasonable early estimate, but the number you check right before sunrise reflects the most current information available, which is why smart planning usually involves more than one check.
How the Formula Behind Your Odds Works
Most snow day calculator use some version of a weighted scoring formula. Each input factor is scored from 0 to 100 based on how severe it is, then multiplied by a weight that reflects how strongly that factor tends to drive real closures.
A simplified version looks like this:
Snow Day Score = (Snowfall × 0.35) + (Ice × 0.20) + (Temperature/Wind Chill × 0.15) + (Storm Timing × 0.12) + (District History × 0.10) + (Infrastructure × 0.05) + (Weather Alerts × 0.03)
Snowfall and ice carry the heaviest weight because they are the strongest predictors of an actual closure. Storm timing and district history matter too, since a storm that lands during the morning commute in a cautious district scores very differently than the same storm hitting a district that rarely closes.
- Snowfall (35%): Total predicted accumulation, with overnight snow weighted more heavily than daytime snow.
- Ice (20%): Freezing rain and black ice risk, which is often more dangerous than snow alone.
- Temperature and wind chill (15%): How cold it will feel at bus-stop times.
- Storm timing (12%): Whether the worst conditions hit during the morning commute or later in the day.
- District history (10%): How cautiously or conservatively your specific district has closed in the past.
- Infrastructure (5%): Plow availability, salt supply, and road maintenance capacity.
- Weather alerts (3%): Active winter storm watches, warnings, or advisories from official forecasters.
Notice that the smallest weights, infrastructure and weather alerts, still matter even though they rarely move the score by more than a few points on their own. They tend to act as tiebreakers. Two storms with nearly identical snowfall and ice numbers can land on opposite sides of a closure decision once infrastructure and active alerts are factored in.
It is also worth understanding why snowfall carries the single largest weight in most formulas. Historical closure data consistently shows that accumulation is the single strongest predictor of an actual district decision, even though ice, timing, and wind chill can each swing an individual storm significantly.
Key Takeaway: Your snow day percentage is a weighted blend of seven factors, not a single number pulled from a weather app. Snowfall and ice drive most of the score, but timing and your district's own history can swing the final percentage significantly.
Reading the Probability Scale
Once you have a percentage, the next question is what it actually means for tomorrow. Most calculators fall into roughly the same four bands.
| Percentage Range | Likelihood | What It Usually Means |
|---|---|---|
| 0% to 30% | Unlikely | Normal school day expected, minor weather at most |
| 31% to 59% | Possible | Worth watching, a delay is more likely than a full closure |
| 60% to 84% | Likely | Strong chance of a delay or closure, prep the night before |
| 85% to 100% | Highly Likely | Closure expected in most similar past storms |
These bands are a general guide, not a fixed rule. A district with a very cautious closure history can call a snow day at 55%, while a district that almost never closes might stay open even at 75%. Checking your district's past closure pattern on the state-by-state predictions page helps you calibrate what your local number really means.
Why Two Nearby Districts Get Different Percentages
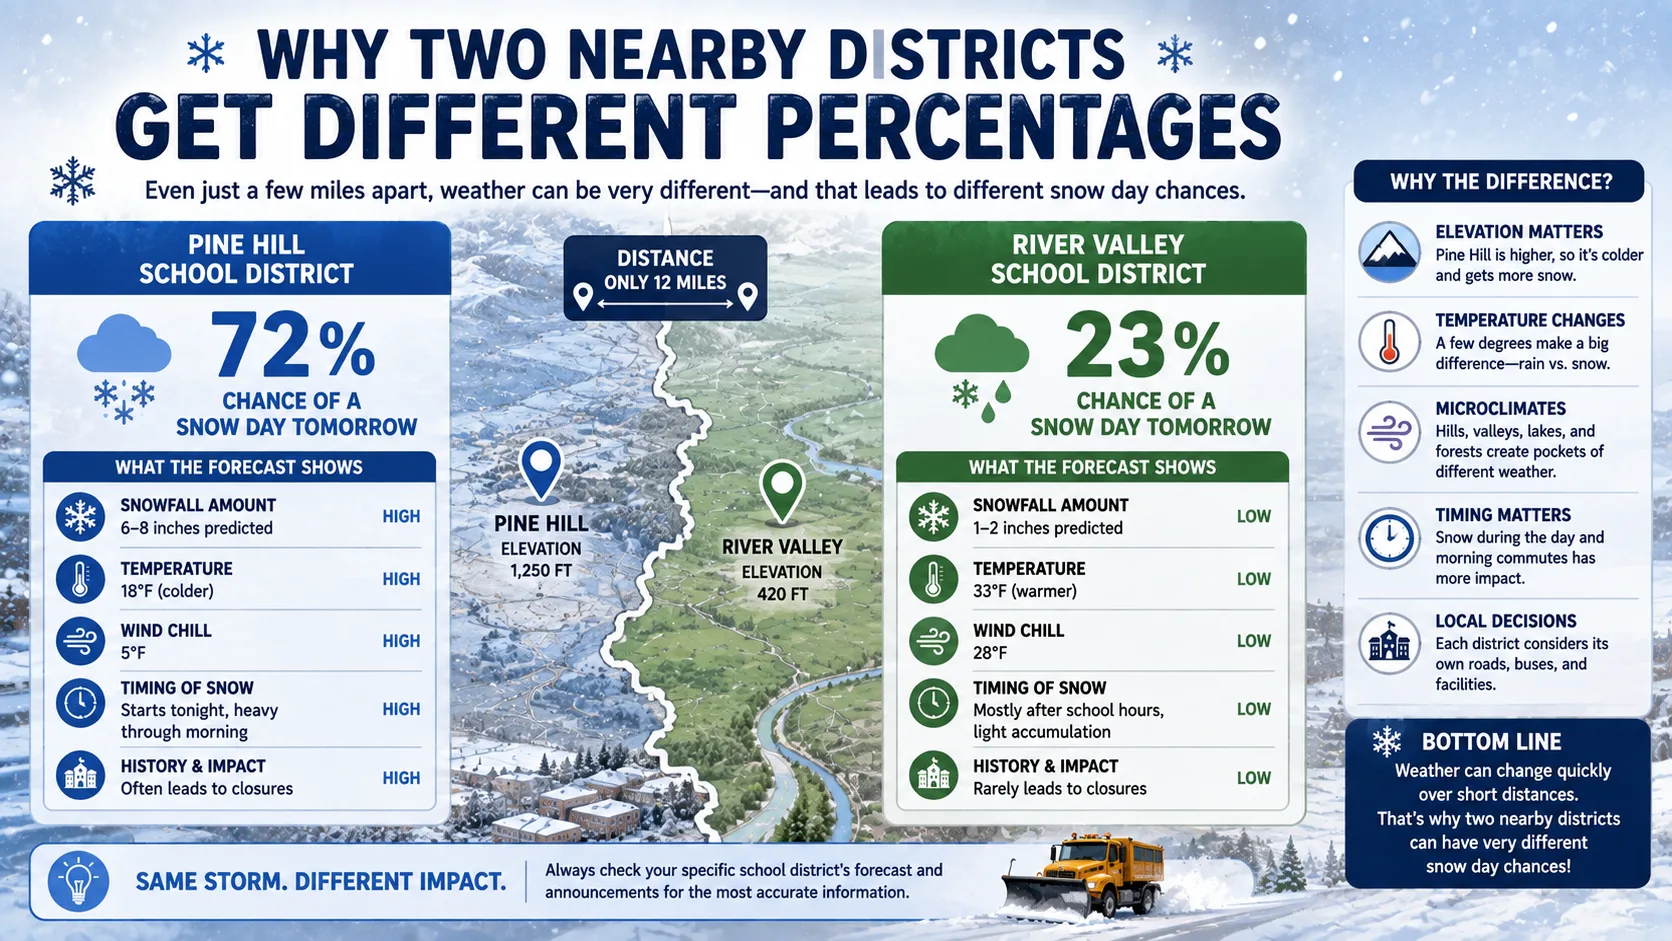
It is common to see two districts twenty minutes apart post noticeably different percentages for the exact same storm. This is not a bug in the math. It reflects real differences in how each district is built to handle winter weather.
Plow Fleets and Salt Reserves
A district with a large plow fleet and deep salt reserves can treat main roads within an hour or two of a storm starting, which lowers the infrastructure portion of the score. A neighboring district with older equipment or a smaller budget may score noticeably higher for the same snowfall total.
Rural Routes vs. Compact City Grids
Districts with long rural bus routes tend to score higher because a single icy back road can strand a bus, even when most of the district looks clear. Compact city districts with shorter, well-maintained routes often score lower for the same storm.
How Cautious the District Has Been Historically
Some districts have a track record of calling closures early, while others try a delay first and only close if conditions worsen. That history is baked directly into the district history portion of the formula, which is why the same raw weather can produce different percentages next door.
Step-by-Step: Checking Your Chances Tonight
- Open a snow day calculator and enter your zip code so it pulls your exact local forecast rather than a regional average.
- Note the percentage and the factor breakdown, since snowfall alone rarely tells the full story.
- Compare the score against your district's typical closure threshold, using past storms as a reference point.
- Recheck between 6 PM and 10 PM, once the overnight forecast has settled.
- Check once more between 4 AM and 6 AM, right before most districts send their official notice.
You can run this same process for delays and early dismissals too. The full calculator directory includes tools built specifically for two-hour delay odds, not just full closures.
A Real-World Example With Numbers
Imagine a forecast calling for 5 inches of snow overnight, a morning wind chill near -12°F, and a storm that peaks right around the 7 AM bus routes, in a district with a moderately cautious closure history.
| Factor | Score (0-100) | Weight | Weighted Value |
|---|---|---|---|
| Snowfall | 85 | 0.35 | 29.75 |
| Ice | 40 | 0.20 | 8.00 |
| Temperature / Wind Chill | 70 | 0.15 | 10.50 |
| Storm Timing | 90 | 0.12 | 10.80 |
| District History | 65 | 0.10 | 6.50 |
| Infrastructure | 50 | 0.05 | 2.50 |
| Weather Alerts | 60 | 0.03 | 1.80 |
| Estimated Total | ~70% |
A roughly 70% score lands in the "Likely" band, meaning this district has historically closed or delayed in most similar storms. That does not guarantee tomorrow's outcome, but it is a strong enough signal to line up backup childcare and pack snow gear the night before.
Why Checking Your Odds Actually Helps
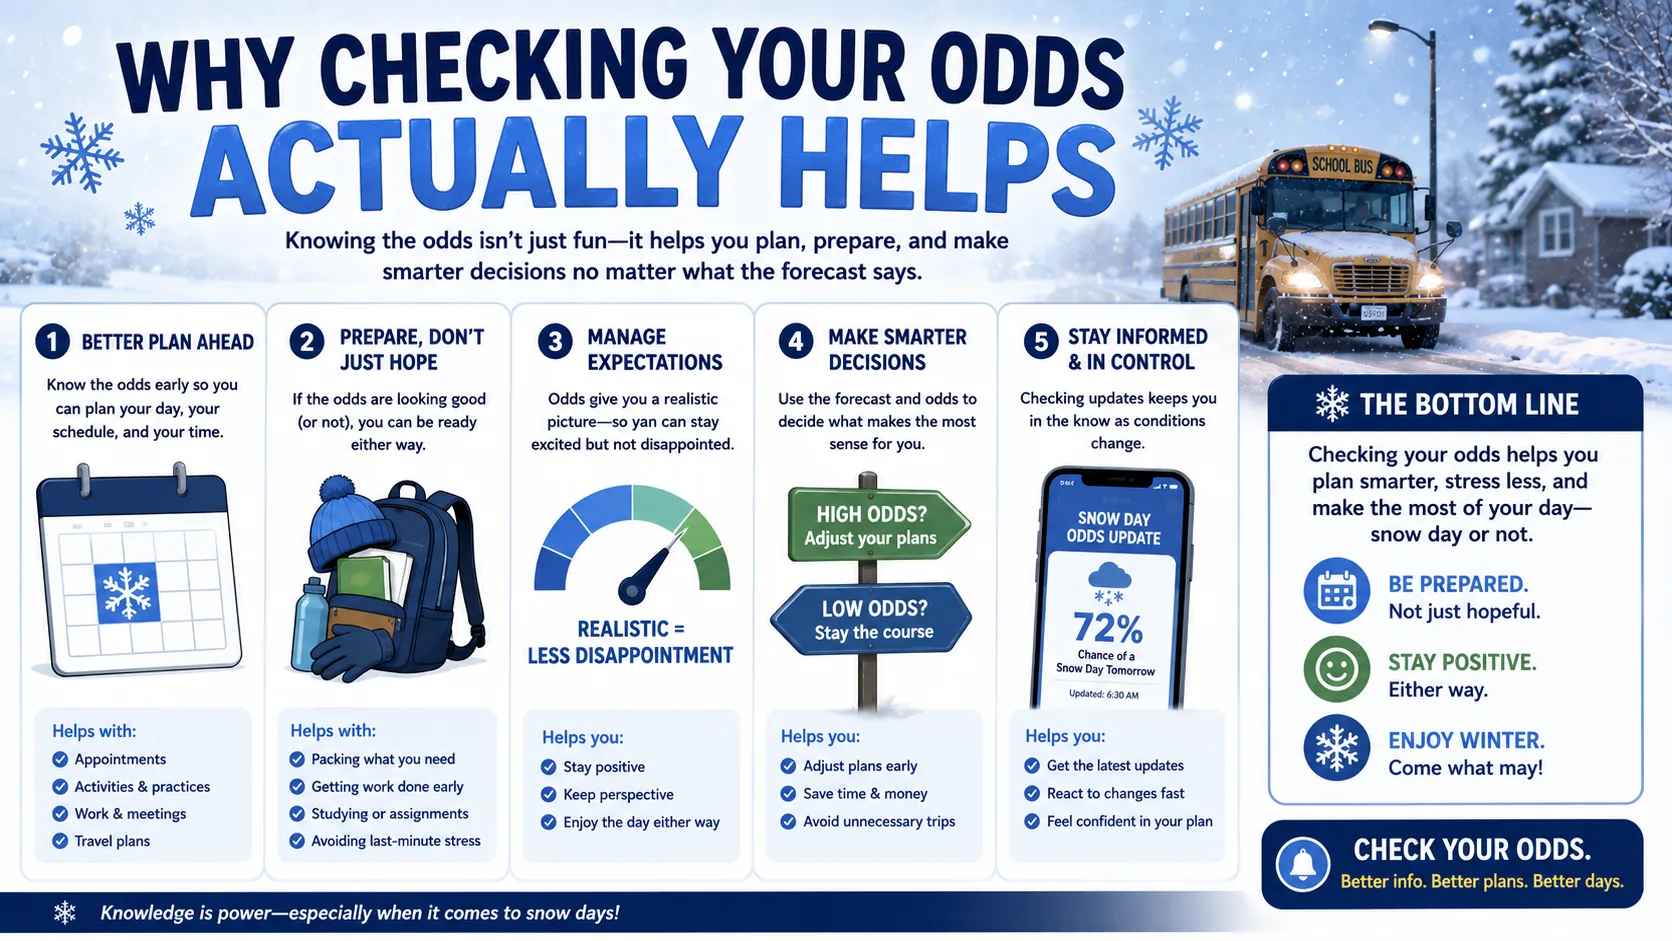
Knowing a percentage instead of a vague guess changes how you plan the evening before a possible storm.
- Parents can arrange backup childcare ahead of time instead of scrambling at 5:30 AM when a text finally arrives.
- Students can pack homework and snow gear the night before instead of guessing in a rush.
- Teachers can decide whether to finish grading tonight or plan for a shortened week.
- Bus drivers and staff get a clearer early signal to plan around a likely delay rather than reacting last minute.
- Working parents can give their own employers a heads up earlier in the evening rather than after a stressful morning scramble.
A percentage also helps manage expectations. A 40% reading tells you a snow day is genuinely possible without promising one, which keeps both excited kids and anxious parents grounded in what the number actually means.
When to Check for the Most Accurate Odds
Timing your check matters almost as much as the calculator itself. Checking too early, say right after lunch the day before a storm, means you are looking at a forecast that still has a lot of room to shift.
- 6 PM to 10 PM the night before: The overnight model runs have mostly settled, giving you a reasonably stable percentage.
- 4 AM to 6 AM the morning of: This is when the score is most accurate, and it lines up with when most districts send their official announcement.
- Avoid relying only on a midday check from the day before, since a storm's track or timing can still shift substantially overnight.
If you only have time for one check, the early morning window is the one that matters most. By 4 AM, the models have absorbed the most recent radar data, and any last-minute wobble in the storm's path has usually already shown up in the score. An evening check is still valuable for planning purposes, but treat it as a preview rather than a final answer.
Some families also find it useful to track how the percentage changes between checks rather than looking at either number in isolation. A score that climbs from 45% at dinnertime to 78% by early morning tells a very different story than a score that stays flat at 45% the whole night, even though both end at the same evening starting point.
Probability Calculator vs. a Plain Weather App
| Approach | What You Get | Accounts for District History | Best For |
|---|---|---|---|
| Snow day probability calculator | A single percentage combining multiple weighted factors | Yes | Estimating your actual closure odds |
| Standard weather app | Raw forecast numbers like snowfall totals and temperature | No | Checking the raw conditions behind the score |
A weather app tells you what the sky is doing. A probability calculator tells you what that weather is likely to mean for your specific school district, which is the question most people are really asking when they search for their odds.
What a Percentage Cannot Tell You
Even the most detailed formula has limits, and knowing where those limits sit helps you use the number correctly instead of over-trusting it.
- It cannot see individual building issues like a broken furnace or a burst pipe that might force a closure regardless of the weather.
- It cannot account for staffing shortages if too many teachers or bus drivers are unable to get to work safely.
- It cannot predict a superintendent's personal risk tolerance, which can shift slightly from year to year even within the same district.
- It cannot replace a last-minute road check, which many districts still do in person before finalizing their decision.
None of this makes the percentage useless. It simply means the number is best treated as a strong, data-driven estimate rather than a certainty, which is exactly how school officials themselves use forecast data when making the real decision. A well-built calculator does the same homework a cautious superintendent does, just faster and with a number attached, which is what makes it such a useful head start on tomorrow's plans.
Read More : Is School Closed Tomorrow?
Common Mistakes and Pro Tips
Mistakes to Avoid
- Treating the percentage as a guarantee. It is a probability estimate, not a confirmed outcome.
- Comparing your score to a friend's in another state. The same percentage can mean very different storms depending on district history.
- Checking only once, too early. Overnight forecast shifts can move the percentage significantly by morning.
- Ignoring the factor breakdown. Two 65% scores can come from very different combinations of snow, ice, and cold.
- Assuming a delay and a closure carry the same percentage threshold. Many districts treat these as separate decisions with different cutoffs.
Pro Tips
- Watch how the percentage trends between your evening and morning checks. A rising number is a stronger signal than a single static reading.
- If wind chill is driving most of the score, check the wind chill calculator separately to understand exactly how cold it will feel at bus-stop time.
- Bookmark your district's page on the homepage calculator so tomorrow's check takes ten seconds instead of a full search.
- Once your district's official announcement posts, trust that over the calculator, since it accounts for on-the-ground details a percentage cannot see.
- Screenshot or note your evening percentage before bed so you can see exactly how much it moved by morning, which is often more useful than either number alone.
- If your family spans two districts, such as a parent's workplace and a child's school, check both scores separately rather than assuming they will match.
Understanding the limits of the number matters just as much as understanding the number itself. A percentage cannot see a downed tree branch on your specific street, a heating problem inside a single school building, or a bus driver calling in sick. These small, hyper-local details are exactly why the official district announcement always has the final say over any calculator score, no matter how high or low that score reads.
See Your Odds Right Now
Instead of guessing based on a snowfall total alone, get the full weighted percentage built from the same factors your district actually considers. Try the calculator above to check your chances tonight, and check again before sunrise for the most accurate read before the official announcement.